Supported Indicators

Fisher Transform

Introduction

The Fisher transform is a mathematical process which is used to convert any data set to a modified data set whose Probability Distribution Function is approximately Gaussian. Once the Fisher transform is computed, the transformed data can then be analyzed in terms of it's deviation from the mean. The equation is y = .5 * ln [ 1 + x / 1 - x ] where x is the input y is the output ln is the natural logarithm The Fisher transform has much sharper turning points than other indicators such as MACD For more info, read chapter 1 of Cybernetic Analysis for Stocks and Futures by John F. Ehlers We are implementing the latest version of this indicator found at Fig. 4 of http://www.mesasoftware.com/papers/UsingTheFisherTransform.pdf

To view the implementation of this indicator, see the LEAN GitHub repository.

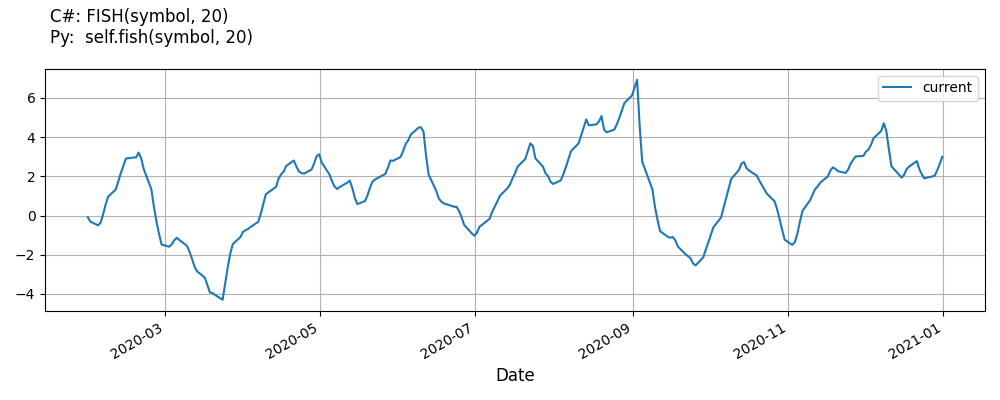
Using FISH Indicator

To create an automatic indicators for FisherTransform, call the FISH helper method from the QCAlgorithm class. The FISH method creates a FisherTransform object, hooks it up for automatic updates, and returns it so you can used it in your algorithm. In most cases, you should call the helper method in the Initializeinitialize method.

public class FisherTransformAlgorithm : QCAlgorithm
{
    private Symbol _symbol;
    private FisherTransform _fish;

    public override void Initialize()
    {
        _symbol = AddEquity("SPY", Resolution.Daily).Symbol;
        _fish = FISH(_symbol, 20);
    }

    public override void OnData(Slice data)
    {
        if (_fish.IsReady)
        {
            // The current value of _fish is represented by itself (_fish)
            // or _fish.Current.Value
            Plot("FisherTransform", "fish", _fish);
            
        }
    }
}
class FisherTransformAlgorithm(QCAlgorithm):
    def initialize(self) -> None:
        self._symbol = self.add_equity("SPY", Resolution.DAILY).symbol
        self.fish = self.FISH(self.symbol, 20)

    def on_data(self, slice: Slice) -> None:
        if self.fish.is_ready:
            # The current value of self.fish is represented by self.fish.current.value
            self.plot("FisherTransform", "fish", self.fish.current.value)
            

The following reference table describes the FISH method:

fish(symbol, period, resolution=None, selector=None)[source]

Creates an FisherTransform indicator for the symbol. The indicator will be automatically updated on the given resolution.

Parameters:
  • symbol (Symbol) — The symbol whose FisherTransform we want
  • period (int) — The period of the FisherTransform
  • resolution (Resolution, optional) — The resolution
  • selector (Callable[IBaseData, TradeBar], optional) — Selects a value from the BaseData to send into the indicator, if null defaults to casting the input value to a TradeBar
Returns:

The FisherTransform for the given parameters

Return type:

FisherTransform

FISH(symbol, period, resolution=None, selector=None)[source]

Creates an FisherTransform indicator for the symbol. The indicator will be automatically updated on the given resolution.

Parameters:
  • symbol (Symbol) — The symbol whose FisherTransform we want
  • period (Int32) — The period of the FisherTransform
  • resolution (Resolution, optional) — The resolution
  • selector (Func<IBaseData, TradeBar>, optional) — Selects a value from the BaseData to send into the indicator, if null defaults to casting the input value to a TradeBar
Returns:

The FisherTransform for the given parameters

Return type:

FisherTransform

If you don't provide a resolution, it defaults to the security resolution. If you provide a resolution, it must be greater than or equal to the resolution of the security. For instance, if you subscribe to hourly data for a security, you should update its indicator with data that spans 1 hour or longer.

For more information about the selector argument, see Alternative Price Fields.

For more information about plotting indicators, see Plotting Indicators.

You can manually create a FisherTransform indicator, so it doesn't automatically update. Manual indicators let you update their values with any data you choose.

Updating your indicator manually enables you to control when the indicator is updated and what data you use to update it. To manually update the indicator, call the Updateupdate method with a TradeBar or QuoteBar. The indicator will only be ready after you prime it with enough data.

public class FisherTransformAlgorithm : QCAlgorithm
{
    private Symbol _symbol;
    private FisherTransform _fish;

    public override void Initialize()
    {
        _symbol = AddEquity("SPY", Resolution.Daily).Symbol;
        _fish = new FisherTransform(20);
    }

    public override void OnData(Slice data)
    {
        if (data.Bars.TryGetValue(_symbol, out var bar))
        {      
            _fish.Update(bar);
        }
   
        if (_fish.IsReady)
        {
            // The current value of _fish is represented by itself (_fish)
            // or _fish.Current.Value
            Plot("FisherTransform", "fish", _fish);
            
        }
    }
}
class FisherTransformAlgorithm(QCAlgorithm):
    def initialize(self) -> None:
        self._symbol = self.add_equity("SPY", Resolution.DAILY).symbol
        self.fish = FisherTransform(20)

    def on_data(self, slice: Slice) -> None:
        bar = slice.bars.get(self._symbol)
        if bar:
            self.fish.update(bar)
        if self.fish.is_ready:
            # The current value of self.fish is represented by self.fish.current.value
            self.plot("FisherTransform", "fish", self.fish.current.value)
            

To register a manual indicator for automatic updates with the security data, call the RegisterIndicatorregister_indicator method.

public class FisherTransformAlgorithm : QCAlgorithm
{
    private Symbol _symbol;
    private FisherTransform _fish;

    public override void Initialize()
    {
        _symbol = AddEquity("SPY", Resolution.Daily).Symbol;
        _fish = new FisherTransform(20);
        RegisterIndicator(_symbol, _fish, Resolution.Daily);
    }

    public override void OnData(Slice data)
    {
        if (_fish.IsReady)
        {
            // The current value of _fish is represented by itself (_fish)
            // or _fish.Current.Value
            Plot("FisherTransform", "fish", _fish);
            
        }
    }
}
class FisherTransformAlgorithm(QCAlgorithm):
    def initialize(self) -> None:
        self._symbol = self.add_equity("SPY", Resolution.DAILY).symbol
        self.fish = FisherTransform(20)
        self.register_indicator(self._symbol, self.fish, Resolution.DAILY)

    def on_data(self, slice: Slice) -> None:
        if self.fish.is_ready:
            # The current value of self.fish is represented by self.fish.current.value
            self.plot("FisherTransform", "fish", self.fish.current.value)
            

The following reference table describes the FisherTransform constructor:

FisherTransform

class QuantConnect.Indicators.FisherTransform[source]

The Fisher transform is a mathematical process which is used to convert any data set to a modified data set whose Probability Distribution Function is approximately Gaussian. Once the Fisher transform is computed, the transformed data can then be analyzed in terms of it's deviation from the mean. The equation is y = .5 * ln [ 1 + x / 1 - x ] where x is the input y is the output ln is the natural logarithm The Fisher transform has much sharper turning points than other indicators such as MACD For more info, read chapter 1 of Cybernetic Analysis for Stocks and Futures by John F. Ehlers We are implementing the latest version of this indicator found at Fig. 4 of http://www.mesasoftware.com/papers/UsingTheFisherTransform.pdf

get_enumerator()

Returns an enumerator that iterates through the history window.

Return type:

IEnumerator[IndicatorDataPoint]

reset()

Resets this indicator to its initial state

to_detailed_string()

Provides a more detailed string of this indicator in the form of {Name} - {Value}

Return type:

str

update(time, value)

Updates the state of this indicator with the given value and returns true if this indicator is ready, false otherwise

Parameters:
  • time (datetime)
  • value (float)
Return type:

bool

update(input)

Updates the state of this indicator with the given value and returns true if this indicator is ready, false otherwise

Parameters:
  • input (IBaseData)
Return type:

bool

property consolidators

The data consolidators associated with this indicator if any

Returns:

The data consolidators associated with this indicator if any

Return type:

ISet[IDataConsolidator]

property current

Gets the current state of this indicator. If the state has not been updated then the time on the value will equal DateTime.MinValue.

Returns:

Gets the current state of this indicator. If the state has not been updated then the time on the value will equal DateTime.MinValue.

Return type:

IndicatorDataPoint

property is_ready

Gets a flag indicating when this indicator is ready and fully initialized

Returns:

Gets a flag indicating when this indicator is ready and fully initialized

Return type:

bool

property item

Indexes the history windows, where index 0 is the most recent indicator value. If index is greater or equal than the current count, it returns null. If the index is greater or equal than the window size, it returns null and resizes the windows to i + 1.

Returns:

Indexes the history windows, where index 0 is the most recent indicator value. If index is greater or equal than the current count, it returns null. If the index is greater or equal than the window size, it returns null and resizes the windows to i + 1.

Return type:

IndicatorDataPoint

property name

Gets a name for this indicator

Returns:

Gets a name for this indicator

Return type:

str

property previous

Gets the previous state of this indicator. If the state has not been updated then the time on the value will equal DateTime.MinValue.

Returns:

Gets the previous state of this indicator. If the state has not been updated then the time on the value will equal DateTime.MinValue.

Return type:

IndicatorDataPoint

property samples

Gets the number of samples processed by this indicator

Returns:

Gets the number of samples processed by this indicator

Return type:

int

property warm_up_period

Required period, in data points, for the indicator to be ready and fully initialized.

Returns:

Required period, in data points, for the indicator to be ready and fully initialized.

Return type:

int

property window

A rolling window keeping a history of the indicator values of a given period

Returns:

A rolling window keeping a history of the indicator values of a given period

Return type:

RollingWindow[IndicatorDataPoint]

FisherTransform

class QuantConnect.Indicators.FisherTransform[source]

The Fisher transform is a mathematical process which is used to convert any data set to a modified data set whose Probability Distribution Function is approximately Gaussian. Once the Fisher transform is computed, the transformed data can then be analyzed in terms of it's deviation from the mean. The equation is y = .5 * ln [ 1 + x / 1 - x ] where x is the input y is the output ln is the natural logarithm The Fisher transform has much sharper turning points than other indicators such as MACD For more info, read chapter 1 of Cybernetic Analysis for Stocks and Futures by John F. Ehlers We are implementing the latest version of this indicator found at Fig. 4 of http://www.mesasoftware.com/papers/UsingTheFisherTransform.pdf

GetEnumerator()

Returns an enumerator that iterates through the history window.

Return type:

IEnumerator[IndicatorDataPoint]

Reset()

Resets this indicator to its initial state

ToDetailedString()

Provides a more detailed string of this indicator in the form of {Name} - {Value}

Return type:

String

Update(time, value)

Updates the state of this indicator with the given value and returns true if this indicator is ready, false otherwise

Parameters:
  • time (DateTime)
  • value (decimal)
Return type:

Boolean

Update(input)

Updates the state of this indicator with the given value and returns true if this indicator is ready, false otherwise

Parameters:
  • input (IBaseData)
Return type:

Boolean

property Consolidators

The data consolidators associated with this indicator if any

Returns:

The data consolidators associated with this indicator if any

Return type:

ISet<IDataConsolidator>

property Current

Gets the current state of this indicator. If the state has not been updated then the time on the value will equal DateTime.MinValue.

Returns:

Gets the current state of this indicator. If the state has not been updated then the time on the value will equal DateTime.MinValue.

Return type:

IndicatorDataPoint

property IsReady

Gets a flag indicating when this indicator is ready and fully initialized

Returns:

Gets a flag indicating when this indicator is ready and fully initialized

Return type:

bool

property Name

Gets a name for this indicator

Returns:

Gets a name for this indicator

Return type:

string

property Previous

Gets the previous state of this indicator. If the state has not been updated then the time on the value will equal DateTime.MinValue.

Returns:

Gets the previous state of this indicator. If the state has not been updated then the time on the value will equal DateTime.MinValue.

Return type:

IndicatorDataPoint

property Samples

Gets the number of samples processed by this indicator

Returns:

Gets the number of samples processed by this indicator

Return type:

int

property WarmUpPeriod

Required period, in data points, for the indicator to be ready and fully initialized.

Returns:

Required period, in data points, for the indicator to be ready and fully initialized.

Return type:

Int32

property Window

A rolling window keeping a history of the indicator values of a given period

Returns:

A rolling window keeping a history of the indicator values of a given period

Return type:

RollingWindow<IndicatorDataPoint>

property [System.Int32]

Indexes the history windows, where index 0 is the most recent indicator value. If index is greater or equal than the current count, it returns null. If the index is greater or equal than the window size, it returns null and resizes the windows to i + 1.

Returns:

Indexes the history windows, where index 0 is the most recent indicator value. If index is greater or equal than the current count, it returns null. If the index is greater or equal than the window size, it returns null and resizes the windows to i + 1.

Return type:

IndicatorDataPoint

Visualization

The following image shows plot values of selected properties of FisherTransform using the plotly library.

FisherTransform line plot.

You can also see our Videos. You can also get in touch with us via Discord.

Did you find this page helpful?

Contribute to the documentation: