
Historical Data
History Requests
Introduction
There are two ways to request historical data in your algorithms: direct historical data requests and indirect algorithm warm up. You can use a direct historical data request at any time throughout your algorithm. It returns all of the data you request as a single object.
Trailing Data Samples
To get historical data for a trailing time period, call history method with an an integer and a Resolution.
For example, if you pass an asset Symbol, 5, and Resolution.MINUTE as the arguments, it returns the data of the asset during the most recent 5 minutes in the asset's market hours.
These trailing minute bars can cross multiple trading days.
class TrailingDataSamplesHistoryAlgorithm(QCAlgorithm):

    def initialize(self) -> None:
        self.set_start_date(2024, 12, 19)
        # Get the Symbol of an asset.
        symbol = self.add_equity('SPY').symbol
        # Get the minute-resolution TradeBar data of the asset over the trailing 5 minutes.
        history = self.history(TradeBar, symbol, 5, Resolution.MINUTE)
| close | high | low | open | volume | ||
|---|---|---|---|---|---|---|
| symbol | time | |||||
| SPY | 2024-12-18 15:56:00 | 588.63 | 590.390 | 588.57 | 590.39 | 1053414.0 |
| 2024-12-18 15:57:00 | 588.34 | 588.910 | 588.24 | 588.61 | 930643.0 | |
| 2024-12-18 15:58:00 | 588.11 | 588.460 | 588.07 | 588.34 | 1138812.0 | |
| 2024-12-18 15:59:00 | 587.92 | 588.325 | 587.70 | 588.10 | 1576391.0 | |
| 2024-12-18 16:00:00 | 586.28 | 587.940 | 585.89 | 587.92 | 5865463.0 |
If you don't pass a Resolution, it defaults to the resolution of the security subscription.
The following example returns 3 days of data for QQQ and 3 minutes of data for SPY:
class TrailingDataSamplesForMulitpleAssetsHistoryAlgorithm(QCAlgorithm):

    def initialize(self) -> None:
        self.set_start_date(2024, 12, 20)
        # Add two assets with different resolutions.
        spy = self.add_equity('SPY', Resolution.MINUTE).symbol
        qqq = self.add_equity('QQQ', Resolution.DAILY).symbol
        # Get the trailing 3 bars of data for each asset.
        history = self.history(TradeBar, [spy, qqq], 3)
| close | high | low | open | volume | ||
|---|---|---|---|---|---|---|
| symbol | time | |||||
| QQQ | 2024-12-17 16:00:00 | 535.80 | 537.49 | 534.130 | 536.410 | 25048673.0 |
| 2024-12-18 16:00:00 | 516.47 | 536.87 | 515.010 | 535.110 | 47016560.0 | |
| 2024-12-19 16:00:00 | 514.17 | 521.75 | 513.830 | 521.110 | 42192908.0 | |
| SPY | 2024-12-19 15:58:00 | 586.40 | 586.77 | 586.365 | 586.730 | 872817.0 |
| 2024-12-19 15:59:00 | 586.50 | 586.83 | 586.380 | 586.420 | 1524079.0 | |
| 2024-12-19 16:00:00 | 586.10 | 586.53 | 585.850 | 586.495 | 4342748.0 |
If there is no data for the time period you request, the result has fewer samples. For instance, say an illiquid asset has no trading activity during the last 15 minutes of the trading day and you request the 10 most recent minute bars at market close, 4 PM Eastern Standard Time (ET). In this case, you won't get any data because LEAN will try to fetch data from 3:50 PM ET to 4 PM ET since the market was open during that time, but there were no trades for the asset. For more information about missing data points, see Missing Data Points.
Trailing Time Periods
To get historical data for a trailing time period, pass a timedelta to the history method.
The days of the timedelta represent calendar days.
class TrailingTimePeriodHistoryAlgorithm(QCAlgorithm):

    def initialize(self) -> None:
        self.set_start_date(2024, 12, 19)
        # Get the Symbol of an asset.
        symbol = self.add_equity('SPY').symbol
        # Get the minute-resolution TradeBar data of the asset over the trailing 3 days.
        history = self.history(TradeBar, symbol, timedelta(3), Resolution.MINUTE)
| close | high | low | open | volume | ||
|---|---|---|---|---|---|---|
| symbol | time | |||||
| SPY | 2024-12-16 09:31:00 | 606.02 | 606.400 | 605.89 | 606.00 | 612650.0 |
| 2024-12-16 09:32:00 | 606.01 | 606.305 | 605.94 | 605.99 | 132785.0 | |
| ... | ... | ... | ... | ... | ... | |
| 2024-12-18 15:59:00 | 587.92 | 588.325 | 587.70 | 588.10 | 1576391.0 | |
| 2024-12-18 16:00:00 | 586.28 | 587.940 | 585.89 | 587.92 | 5865463.0 |
If there is no data in the time period, the result is empty. For more information about missing data points, see Missing Data Points.
Date Ranges
To get historical data for a specific date range, call history method with start and end datetime objects.
The datetime objects you provide are based in the algorithm time zone.
class DateRangeHistoryAlgorithm(QCAlgorithm):

    def initialize(self) -> None:
        self.set_start_date(2024, 12, 1)
        # Get the Symbol of an asset.
        symbol = self.add_equity('SPY').symbol
        # Get the daily-resolution TradeBar data of the asset during 2020.
        history = self.history(TradeBar, symbol, datetime(2020, 1, 1), datetime(2021, 1, 1), Resolution.DAILY)
| close | high | low | open | volume | ||
|---|---|---|---|---|---|---|
| symbol | time | |||||
| SPY | 2020-01-02 16:00:00 | 301.194352 | 301.194352 | 299.029520 | 299.998363 | 52757344.0 |
| 2020-01-03 16:00:00 | 298.913630 | 300.053991 | 297.708370 | 297.782540 | 65558742.0 | |
| 2020-01-06 16:00:00 | 300.053991 | 300.137432 | 297.013028 | 297.087198 | 47199709.0 | |
| 2020-01-07 16:00:00 | 299.210309 | 299.956643 | 298.756019 | 299.479175 | 37979987.0 | |
| 2020-01-08 16:00:00 | 300.804960 | 302.038033 | 299.163953 | 299.451361 | 62265971.0 | |
| ... | ... | ... | ... | ... | ... | |
| 2020-12-24 13:00:00 | 348.496921 | 348.496921 | 347.033045 | 347.609151 | 22897100.0 | |
| 2020-12-28 16:00:00 | 351.490783 | 351.887446 | 350.451904 | 351.150786 | 34765681.0 | |
| 2020-12-29 16:00:00 | 350.820234 | 353.219101 | 350.225239 | 353.077436 | 48584327.0 | |
| 2020-12-30 16:00:00 | 351.320785 | 352.350220 | 350.933566 | 351.689115 | 46030043.0 | |
| 2020-12-31 16:00:00 | 353.105769 | 353.825429 | 350.612458 | 351.188564 | 58258603.0 |
If there is no data for the date range you request, the result is empty. For more information about missing data points, see Missing Data Points.
Flat Universe DataFrames
Most history requests return a flat DataFrame by default, where there is one column for each data point attribute.
Universe history requests return a Series, where the values in the Series are lists of the universe data objects.
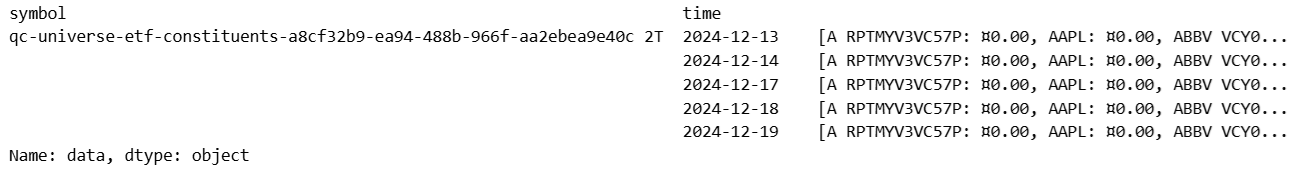
For example, the following code snippet returns a Series where each value is a List[ETFConstituentUniverse]:
class SeriesUniverseHistoryAlgorithm(QCAlgorithm):

    def initialize(self) -> None:
        self.set_start_date(2024, 12, 19)
        # Add an ETF constituents universe for SPY so you can get its historical data.
        universe = self.add_universe(self.universe.etf('SPY'))
        # Get the trailing 5 days of universe data.
        history = self.history(universe, 5, Resolution.DAILY)
To get the data into a DataFrame instead, set the flatten argument to True. In this case, the DataFrame has one column for each data point attribute.
# Get the trailing 5 days of universe data in DataFrame format
# so you can perform DataFrame wrangling operations.
history = self.history(universe, 5, Resolution.DAILY, flatten=True)
| lastupdate | period | sharesheld | weight | ||
|---|---|---|---|---|---|
| time | symbol | ||||
| 2024-12-13 | A RPTMYV3VC57P | 2024-12-11 | 1 days | 3667879.0 | 0.000799 |
| AAPL R735QTJ8XC9X | 2024-12-11 | 1 days | 190881735.0 | 0.072612 | |
| ABBV VCY032R250MD | 2024-12-11 | 1 days | 22169383.0 | 0.005966 | |
| ABNB XK8H247DY6W5 | 2024-12-11 | 1 days | 5515085.0 | 0.001182 | |
| ABT R735QTJ8XC9X | 2024-12-11 | 1 days | 21833687.0 | 0.003846 | |
| ... | ... | ... | ... | ... | ... |
| 2024-12-19 | XYL V18KR26TE3XH | 2024-12-17 | 1 days | 3065334.0 | 0.000572 |
| YUM R735QTJ8XC9X | 2024-12-17 | 1 days | 3548979.0 | 0.000739 | |
| ZMH S6ZZPKTVDY05 | 2024-12-17 | 1 days | 2570208.0 | 0.000429 | |
| ZBRA R735QTJ8XC9X | 2024-12-17 | 1 days | 650402.0 | 0.000397 | |
| ZTS VDRJHVQ4FNFP | 2024-12-17 | 1 days | 5703558.0 | 0.001505 |
Default Values
The following table describes the assumptions of the History API:
| Argument | Assumption |
|---|---|
resolution | LEAN guesses the resolution you request by looking at the securities you already have in your algorithm. If you have a security subscription in your algorithm with a matching Symbol, the history request uses the same resolution as the subscription. If you don't have a security subscription in your algorithm with a matching Symbol, Resolution.MINUTE is the default. |
Additional Options
The history method accepts the following additional arguments:
| Argument | Data Type | Description | Default Value |
|---|---|---|---|
fill_forward | bool/NoneType | True to fill forward missing data. Otherwise, false. If you don't provide a value, it uses the fill forward mode of the security subscription. | None |
extended_market_hours | bool/NoneType | True to include extended market hours data. Otherwise, false. | None |
data_mapping_mode | DataMappingMode/NoneType | The contract mapping mode to use for the security history request. | None |
data_normalization_mode | DataNormalizationMode/NoneType | The price scaling mode to use for US Equities or continuous Futures contracts. If you don't provide a value, it uses the data normalization mode of the security subscription. | None |
contract_depth_offset | int/NoneType | The desired offset from the current front month for continuous Futures contracts. | None |
self.future = self.add_future(Futures.Indices.SP_500_E_MINI)
history = self.history(
    symbols=[self.future.symbol],
    start=self.time - timedelta(days=15),
    end=self.time,
    resolution=Resolution.MINUTE,
    fill_forward=False,
    extended_market_hours=False,
    data_mapping_mode=DataMappingMode.LAST_TRADING_DAY,
    data_normalization_mode=DataNormalizationMode.RAW,
    contract_depth_offset=0
)
Examples
The following examples demonstrate some common practices for trading using historical requests.
Example 1: Mean-Variance Portfolio
The following algorithm constructs a monthly rebalance mean-variance portfolio using the top 20 liquid equities. The position sizing can be optimized by 1-year historical daily return of the universe members.
from Portfolio.MaximumSharpeRatioPortfolioOptimizer import MaximumSharpeRatioPortfolioOptimizer

class HistoricalRequestAlgorithm(QCAlgorithm):
    def initialize(self) -> None:
        self.set_start_date(2020, 4, 1)
        self.set_end_date(2020, 9, 30)

        # Monthly renewal of the top 20 liquid universe to trade popular stocks.
        self.universe_settings.schedule.on(self.date_rules.month_start())
        self._universe = self.add_universe(self.universe.dollar_volume.top(20))

        # Instantiate the optimizer to perform mean-variance optimization.
        # Mean-variance optimization will not consider a risk-free rate, so we use 0.
        self._optimizer = MaximumSharpeRatioPortfolioOptimizer(0.0, 1.0, 0.0)

        # Set a scheduled event to rebalance the portfolio at the start of every month.
        self.schedule.on(
            self.date_rules.month_start(),
            self.time_rules.at(9, 31),
            self.rebalance
        )

    def rebalance(self) -> None:
        # Historical data request to get 1-year data for optimization.
        symbols = self._universe.selected
        history = self.history(symbols, 253, Resolution.DAILY).close.unstack(0).dropna()
        # Daily return on the universe members to calculate the optimized weights.
        returns = history.pct_change().dropna()

        # Calculate the optimized weights.
        weights = self._optimizer.optimize(returns)

        # Rebalance the portfolio according to the optimized weights.
        targets = [PortfolioTarget(symbol, size) for symbol, size in zip(symbols, weights)]
        self.set_holdings(targets, liquidate_existing_holdings=True)
Other Examples
For more examples, see the following algorithms:
You can also see our Videos. You can also get in touch with us via Discord.
Did you find this page helpful?