
Datasets
Key Concepts
Key History Concepts
The historical data API has many different options to give you the greatest flexibility in how to apply it to your algorithm.
Time Period Options
You can request historical data based on a trailing number of bars, a trailing period of time, or a defined period of time. If you request data in a defined period of time, the datetime objects you provide are based in the notebook time zone.
Return Formats
Each asset class supports slightly different data formats. When you make a history request, consider what data returns. Depending on how you request the data, history requests return a specific data type. For example, if you don't provide Symbol objects, you get Slice objects that contain all of the assets you created subscriptions for in the notebook.
The most popular return type is a DataFrame. If you request a DataFrame, LEAN unpacks the data from Slice objects to populate the DataFrame. If you intend to use the data in the DataFrame to create TradeBar or QuoteBar objects, request that the history request returns the data type you need. Otherwise, LEAN will waste computational resources populating the DataFrame.
Time Index
When your history request returns a DataFrame, the timestamps in the DataFrame are based on the data time zone. When your history request returns a TradeBars, QuoteBars, Ticks, or Slice object, the time properties of these objects are based on the notebook time zone, but the end_time properties of the individual TradeBar, QuoteBar, and Tick objects are based on the data time zone. The end_time is the end of the sampling period and when the data is actually available. For daily US Equity data, this results in data points appearing on Saturday and skipping Monday.
Request Data
The simplest form of history request is for a known set of Symbol objects.
History requests return slightly different data depending on the overload you call. The data that returns is in ascending order from oldest to newest.
Single Symbol History Requests
To request history for a single asset, pass the asset Symbol to the history method. The return type of the method call depends on the history request [Type]. The following table describes the return type of each request [Type]:
| Request Type | Return Data Type |
|---|---|
| No argument | DataFrame |
TradeBar | List[TradeBars] |
QuoteBar | List[QuoteBars] |
Tick | List[Ticks] |
alternativeDataClass(ex: CBOE) | List[alternativeDataClass](ex: List[CBOE]) |
Each row of the DataFrame represents the prices at a point in time. Each column of the DataFrame is a property of that price data (for example, open, high, low, and close (OHLC)). If you request a DataFrame object and pass TradeBar as the first argument, the DataFrame that returns only contains the OHLC and volume columns. If you request a DataFrame object and pass QuoteBar as the first argument, the DataFrame that returns contains the OHLC of the bid and ask and it contains OHLC columns, which are the respective means of the bid and ask OHLC values. If you request a DataFrame and don't pass TradeBar or QuoteBar as the first arugment, the DataFrame that returns contains columns for all of the data that's available for the given resolution.
# EXAMPLE 1: Requesting By Bar Count: 5 bars at the security resolution:
vix_symbol = qb.add_data(CBOE, "VIX", Resolution.DAILY).symbol
cboe_data = qb.history[CBOE](vix_symbol, 5)

btc_symbol = qb.add_crypto("BTCUSD", Resolution.MINUTE).symbol
trade_bars = qb.history[TradeBar](btc_symbol, 5)
quote_bars = qb.history[QuoteBar](btc_symbol, 5)
trade_bars_df = qb.history(TradeBar, btc_symbol, 5)
quote_bars_df = qb.history(QuoteBar, btc_symbol, 5)
df = qb.history(btc_symbol, 5)   # Includes trade and quote data
# EXAMPLE 2: Requesting By Bar Count: 5 bars with a specific resolution:
trade_bars = qb.history[TradeBar](btc_symbol, 5, Resolution.DAILY)
quote_bars = qb.history[QuoteBar](btc_symbol, 5, Resolution.MINUTE)
trade_bars_df = qb.history(TradeBar, btc_symbol, 5, Resolution.MINUTE)
quote_bars_df = qb.history(QuoteBar, btc_symbol, 5, Resolution.MINUTE)
df = qb.history(btc_symbol, 5, Resolution.MINUTE)  # Includes trade and quote data
# EXAMPLE 3: Requesting By a Trailing Period: 3 days of data at the security resolution:
eth_symbol = qb.add_crypto('ETHUSD', Resolution.TICK).symbol
ticks = qb.history[Tick](eth_symbol, timedelta(days=3))
ticks_df = qb.history(eth_symbol, timedelta(days=3))

vix_data = qb.history[CBOE](vix_symbol, timedelta(days=3))
trade_bars = qb.history[TradeBar](btc_symbol, timedelta(days=3))
quote_bars = qb.history[QuoteBar](btc_symbol, timedelta(days=3))
trade_bars_df = qb.history(TradeBar, btc_symbol, timedelta(days=3))
quote_bars_df = qb.history(QuoteBar, btc_symbol, timedelta(days=3))
df = qb.history(btc_symbol, timedelta(days=3))  # Includes trade and quote data
# EXAMPLE 4: Requesting By a Trailing Period: 3 days of data with a specific resolution: trade_bars = qb.history[TradeBar](btc_symbol, timedelta(days=3), Resolution.DAILY) quote_bars = qb.history[QuoteBar](btc_symbol, timedelta(days=3), Resolution.MINUTE) ticks = qb.history[Tick](eth_symbol, timedelta(days=3), Resolution.TICK) trade_bars_df = qb.history(TradeBar, btc_symbol, timedelta(days=3), Resolution.DAILY) quote_bars_df = qb.history(QuoteBar, btc_symbol, timedelta(days=3), Resolution.MINUTE) ticks_df = qb.history(eth_symbol, timedelta(days=3), Resolution.TICK) df = qb.history(btc_symbol, timedelta(days=3), Resolution.HOUR) # Includes trade and quote data# Important Note: Period history requests are relative to "now" notebook time.
# EXAMPLE 5: Requesting By a Defined Period: 3 days of data at the security resolution:
start_time = datetime(2022, 1, 1)
end_time = datetime(2022, 1, 4)

vix_data = qb.history[CBOE](vix_symbol, start_time, end_time)
trade_bars = qb.history[TradeBar](btc_symbol, start_time, end_time)
quote_bars = qb.history[QuoteBar](btc_symbol, start_time, end_time)
ticks = qb.history[Tick](eth_symbol, start_time, end_time)

trade_bars_df = qb.history(TradeBar, btc_symbol, start_time, end_time)
quote_bars_df = qb.history(QuoteBar, btc_symbol, start_time, end_time)
ticks_df = qb.history(Tick, eth_symbol, start_time, end_time)
df = qb.history(btc_symbol, start_time, end_time)  # Includes trade and quote data
# EXAMPLE 6: Requesting By a Defined Period: 3 days of data with a specific resolution:
trade_bars = qb.history[TradeBar](btc_symbol, start_time, end_time, Resolution.DAILY)
quote_bars = qb.history[QuoteBar](btc_symbol, start_time, end_time, Resolution.MINUTE)
ticks = qb.history[Tick](eth_symbol, start_time, end_time, Resolution.TICK)

trade_bars_df = qb.history(TradeBar, btc_symbol, start_time, end_time, Resolution.DAILY)
quote_bars_df = qb.history(QuoteBar, btc_symbol, start_time, end_time, Resolution.MINUTE)
ticks_df = qb.history(eth_symbol, start_time, end_time, Resolution.TICK)
df = qb.history(btc_symbol, start_time, end_time, Resolution.HOUR)  # Includes trade and quote data
Multiple Symbol History Requests
To request history for multiple symbols at a time, pass an array of Symbol objects to the same API methods shown in the preceding section. The return type of the method call depends on the history request [Type]. The following table describes the return type of each request [Type]:
| Request Type | Return Data Type |
|---|---|
| No argument | DataFrame |
TradeBar | List[TradeBars] |
QuoteBar | List[QuoteBars] |
Tick | List[Ticks] |
alternativeDataClass(ex: CBOE) | List[dict[Symbol, alternativeDataClass]](ex: List[dict[Symbol, CBOE]]) |
# EXAMPLE 7: Requesting By Bar Count for Multiple Symbols: 2 bars at the security resolution:
vix = qb.add_data[CBOE]("VIX", Resolution.DAILY).symbol
v3m = qb.add_data[CBOE]("VIX3M", Resolution.DAILY).symbol
cboe_data = qb.history[CBOE]([vix, v3m], 2)

ibm = qb.add_equity("IBM", Resolution.MINUTE).symbol
aapl = qb.add_equity("AAPL", Resolution.MINUTE).symbol
trade_bars_list = qb.history[TradeBar]([ibm, aapl], 2)
quote_bars_list = qb.history[QuoteBar]([ibm, aapl], 2)

trade_bars_df = qb.history(TradeBar, [ibm, aapl], 2)
quote_bars_df = qb.history(QuoteBar, [ibm, aapl], 2)
df = qb.history([ibm, aapl], 2)  # Includes trade and quote data
# EXAMPLE 8: Requesting By Bar Count for Multiple Symbols: 5 bars with a specific resolution:
trade_bars_list = qb.history[TradeBar]([ibm, aapl], 5, Resolution.DAILY)
quote_bars_list = qb.history[QuoteBar]([ibm, aapl], 5, Resolution.MINUTE)

trade_bars_df = qb.history(TradeBar, [ibm, aapl], 5, Resolution.DAILY)
quote_bars_df = qb.history(QuoteBar, [ibm, aapl], 5, Resolution.MINUTE)
df = qb.history([ibm, aapl], 5, Resolution.DAILY)  # Includes trade data only. No quote for daily equity data
# EXAMPLE 9: Requesting By Trailing Period: 3 days of data at the security resolution:
ticks = qb.history[Tick]([eth_symbol], timedelta(days=3))

trade_bars = qb.history[TradeBar]([btc_symbol], timedelta(days=3))
quote_bars = qb.history[QuoteBar]([btc_symbol], timedelta(days=3))
trade_bars_df = qb.history(TradeBar, [btc_symbol], timedelta(days=3))
quote_bars_df = qb.history(QuoteBar, [btc_symbol], timedelta(days=3))
df = qb.history([btc_symbol], timedelta(days=3))  # Includes trade and quote data
# EXAMPLE 10: Requesting By Defined Period: 3 days of data at the security resolution:
trade_bars = qb.history[TradeBar]([btc_symbol], start_time, end_time)
quote_bars = qb.history[QuoteBar]([btc_symbol], start_time, end_time)
ticks = qb.history[Tick]([eth_symbol], start_time, end_time)
trade_bars_df = qb.history(TradeBar, btc_symbol, start_time, end_time)
quote_bars_df = qb.history(QuoteBar, btc_symbol, start_time, end_time)
ticks_df = qb.history(Tick, eth_symbol, start_time, end_time)
df = qb.history([btc_symbol], start_time, end_time)  # Includes trade and quote data
If you request data for multiple securities and you use the TICK request type, each Ticks object in the list of results only contains the last tick of each security for that particular timeslice.
All Symbol History Requests
You can request history for all the securities you have created subscriptions for in your notebook session. The parameters are very similar to other history method calls, but the return type is an array of Slice objects. The Slice object holds all of the results in a sorted enumerable collection that you can iterate over with a loop.
# EXAMPLE 11: Requesting 5 bars for all securities at their respective resolution:

# Create subscriptions
qb.add_equity("IBM", Resolution.DAILY)
qb.add_equity("AAPL", Resolution.DAILY)

# Request history data and enumerate results
slices = qb.history(5)
for s in slices:
    print(str(s.time) + " AAPL:" + str(s.bars["AAPL"].close) + " IBM:" + str(s.bars["IBM"].close))

# EXAMPLE 12: Requesting 5 minutes for all securities: slices = qb.history(timedelta(minutes=5), Resolution.MINUTE) for s in slices: print(str(s.time) + " AAPL:" + str(s.bars["AAPL"].close) + " IBM:" + str(s.bars["IBM"].close))# timedelta history requests are relative to "now" in notebook Time. If you request this data at 16:05, it returns an empty array because the market is closed.

Assumed Default Values
The following table describes the assumptions of the History API:
| Argument | Assumption |
|---|---|
| Resolution | LEAN guesses the resolution you request by looking at the securities you already have in your notebook. If you have a security subscription in your notebook with a matching Symbol, the history request uses the same resolution as the subscription. If you don't have a security subscription in your notebook with a matching Symbol, Resolution.MINUTE is the default. |
Additional Options
The history method accepts the following additional arguments:
| Argument | Data Type | Description | Default Value |
|---|---|---|---|
fill_forward | bool/NoneType | True to fill forward missing data. Otherwise, false. If you don't provide a value, it uses the fill forward mode of the security subscription. | None |
extended_market_hours | bool/NoneType | True to include extended market hours data. Otherwise, false. | None |
data_mapping_mode | DataMappingMode/NoneType | The contract mapping mode to use for the security history request. | None |
data_normalization_mode | DataNormalizationMode/NoneType | The price scaling mode to use for US Equities or continuous Futures contracts. If you don't provide a value, it uses the data normalization mode of the security subscription. | None |
contract_depth_offset | int/NoneType | The desired offset from the current front month for continuous Futures contracts. | None |
future = qb.add_future(Futures.Currencies.BTC)
history = qb.history(
    tickers=[future.symbol],
    start=qb.time - timedelta(days=15),
    end=qb.time,
    resolution=Resolution.MINUTE,
    fill_forward=False,
    extended_market_hours=False,
    dataMappingMode=DataMappingMode.OPEN_INTEREST,
    dataNormalizationMode=DataNormalizationMode.RAW,
    contractDepthOffset=0)
Resolutions
Resolution is the duration of time that's used to sample a data source. The Resolution enumeration has the following members:
The default resolution for market data is MINUTE. To set the resolution for a security, pass the resolution argument when you create the security subscription.
qb.add_equity("SPY", Resolution.DAILY)
When you request historical data, the history method uses the resolution of your security subscription. To get historical data with a different resolution, pass a resolution argument to the history method.
history = qb.history(spy, 10, Resolution.MINUTE)
Markets
The datasets integrated into the Dataset Market cover many markets. The Market enumeration has the following members:
LEAN can usually determine the correct market based on the ticker you provide when you create the security subscription. To manually set the market for a security, pass a market argument when you create the security subscription.
qb.add_equity("SPY", market=Market.USA)
Fill Forward
Fill forward means if there is no data point for the current sample, LEAN uses the previous data point. Fill forward is the default data setting. To disable fill forward for a security, set the fill_forward argument to false when you create the security subscription.
qb.add_equity("SPY", fill_forward=False)
When you request historical data, the history method uses the fill forward setting of your security subscription. To get historical data with a different fill forward setting, pass a fill_forward argument to the history method.
history = qb.history(qb.securities.keys(), qb.time-timedelta(days=10), qb.time, fillForward=True)
Extended Market Hours
By default, your security subscriptions only cover regular trading hours. To subscribe to pre and post-market trading hours for a specific asset, enable the extended_market_hours argument when you create the security subscription.
self.add_equity("SPY", extended_market_hours=True)
You only receive extended market hours data if you create the subscription with minute, second, or tick resolution. If you create the subscription with daily or hourly resolution, the bars only reflect the regular trading hours.
When you request historical data, the history method uses the extended market hours setting of your security subscription. To get historical data with a different extended market hours setting, pass an extended_market_hours argument to the history method.
history = qb.history(qb.securities.keys(), qb.time-timedelta(days=10), qb.time, extended_market_hours=False)
Look-Ahead Bias
In the Research Environment, all the historical data is directly available. In backtesting, you can only access the data that is at or before the algorithm time. If you make a history request for the previous 10 days of data in the Research Environment, you get the previous 10 days of data from today's date. If you request the same data in a backtest, you get the previous 10 days of data from the algorithm time.
Consolidate Data
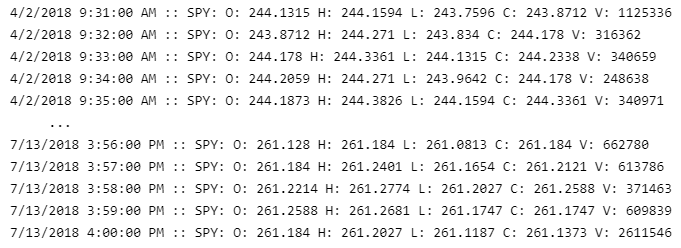
History requests usually return data in one of the standard resolutions. To analyze data on custom time frames like 5-minute bars or 4-hour bars, you need to aggregate it. Consider an example where you make a history call for minute resolution data and want to create 5-minute resolution data.
qb = QuantBook()
symbol = qb.add_equity("SPY").symbol
start_date = datetime(2018, 4, 1)
end_date = datetime(2018, 7, 15)
history = qb.history(symbol, start_date, end_date, Resolution.MINUTE)

To aggregate the data, use a consolidator or the pandas resample method.
Consolidators
The following snippet demonstrates how to use a consolidator to aggregate data:
# Set up a consolidator and a RollingWindow to save the data
consolidator = TradeBarConsolidator(timedelta(7))
window = RollingWindow[TradeBar](20)

# Attach a consolidation handler method that saves the consolidated bars in the RollingWindow
def on_data_consolidated(sender, bar):
     window.add(bar)
consolidator.data_consolidated += on_data_consolidated

# Iterate the historical market data and feed each bar into the consolidator
for bar in history.itertuples():
    tradebar = TradeBar(bar.index[1], bar.index[0], bar.open, bar.high, bar.low, bar.close, bar.volume)
    consolidator.update(tradebar)
Resample Method
The resample method converts the frequency of a time series DataFrame into a custom frequency. The method only works on DataFrame objects that have a datetime index. The history method returns a DataFrame with a multi-index. The first index is a Symbol index for each security and the second index is a time index for the timestamps of each row of data. To make the DataFrame compatible with the resample method, call the reset_index method to drop the Symbol index.
# Drop level 0 index (Symbol index) from the DataFrame
history.reset_index(level = 0, drop = True, inplace=True)

The resample method returns a Resampler object, which needs to be downsampled using one of the pandas downsampling computations. For example, you can use the Resampler.ohlc downsampling method to aggregate price data.
When you resample a DataFrame with the ohlc downsampling method, it creates an OHLC row for each column in the DataFrame. To just calculate the OHLC of the close column, select the close column before you resample the DataFrame. A resample offset of 5T corresponds to a 5-minute resample. Other resampling offsets include 2D = 2 days, 5H = 5 hours, and 3S = 3 seconds.
close_prices = history["close"]

offset = "5T"
close_5min_ohlc = close_prices.resample(offset).ohlc()

Common Errors
If the history request returns an empty DataFrame and you try to slice it, it throws an exception. To avoid issues, check if the DataFrame contains data before slicing it.
df = qb.history(symbol, 10).close    # raises exception if the request is empty

def get_safe_history_closes(symbols):
    if not symbols:
        print(f'No symbols')
        return  False, None
    df = qb.history(symbols, 100, Resolution.DAILY)
    if df.empty:
        print(f'Empy history for {symbols}')
        return  False, None
     return True, df.close.unstack(0)
If you run the Research Environment on your local machine and history requests return no data, check if your data directory contains the data you request. To download datasets, see Download.
Examples
The following examples demonstrate some common practices for applying datasets.
Example 1: Futures 5-Minute Bid-Ask
The following example studies the trend on the SP500 EMini Future contract. To study the short term supply-demand relationship, we consolidate the data into 5 minute bars and calculate the bid and ask dollar volume.
# Create a QuantBook
qb = QuantBook()

# Request the continuous future historical data.
# Use raw normalization mode to fairly compare the actual bid and ask dollar volume.
future = qb.add_future(Futures.Indices.SP_500_E_MINI)
history = qb.history(future.symbol,
    start=qb.time - timedelta(days=182),
    end=qb.time,
    resolution=Resolution.MINUTE,
    fill_forward=True,
    extended_market_hours=True,
    data_mapping_mode=DataMappingMode.LAST_TRADING_DAY,
    data_normalization_mode=DataNormalizationMode.RAW,
    contract_depth_offset=0)

# Drop level 0, 1 index (Expiry, Symbol index) from the DataFrame
history = history.droplevel([0, 1])

# Select the required columns to calculate the estimated bid and ask size.
history = history[["askhigh", "asklow", "asksize", "bidhigh", "bidlow", "bidsize"]].resample("5T").agg({
    "askhigh": "max",       # Get the highest ask price in the last 5 mintues
    "asklow": "min",        # Get the lowest ask price in the last 5 mintues
    "asksize": "sum",       # Get the total ask volume in the last 5 mintues
    "bidhigh": "max",       # Get the highest bid price in the last 5 mintues
    "bidlow": "min",        # Get the lowest bid price in the last 5 mintues
    "bidsize": "sum"        # Get the total bid volume in the last 5 mintues
})
# Take the average of the highest and lowest price in the last 5 mintues as the estimated average price.
history["ask_dollar_volume"] = (history["askhigh"] + history["asklow"]) * 0.5 * history["asksize"]
history["bid_dollar_volume"] = (history["bidhigh"] + history["bidlow"]) * 0.5 * history["bidsize"]
history
You can also see our Videos. You can also get in touch with us via Discord.
Did you find this page helpful?