
Futures
Universes
Create Subscriptions
Follow these steps to subscribe to a Futures universe:
- Create a
QuantBook. - Call the
add_futuremethod with a ticker, resolution, and contract rollover settings.
qb = QuantBook()
future = qb.add_future(
    Futures.Indices.SP_500_E_MINI,
    Resolution.MINUTE,
    data_normalization_mode=DataNormalizationMode.BACKWARDS_RATIO,
    data_mapping_mode=DataMappingMode.LAST_TRADING_DAY,
    contract_depth_offset=0
)
To view the available tickers in the US Futures dataset, see Supported Assets.
If you omit any of the arguments after the ticker, see the following table for their default values:
| Argument | Default Value |
|---|---|
resolution | Resolution.MINUTE |
data_normalization_mode | DataNormalizationMode.ADJUSTED |
data_mapping_mode | DataMappingMode.OpenInterest |
contract_depth_offset | 0 |
Contract Price History
The contract filter determines which Futures contracts are in your universe each trading day.
The default filter doesn't select any contracts.
To change the filter, call the set_filter method.
# Set the contract filter to select contracts that expire within 180 days.
future.set_filter(0, 180)
To get the prices and volumes for all of the Futures contracts that pass your filter during a specific period of time, call the future_history method with the Symbol of the continuous Futures contract, a start datetime, and an end datetime.
# Set the contract filter to select contracts that expire within 180 days.
history = qb.future_history(
    future.Symbol, datetime(2025, 4, 1), datetime(2025, 4, 3), Resolution.MINUTE,
    fill_forward=False, extended_market_hours=False
)
The future_history method returns a FutureHistory object. To get each Slice in the FutureHistory object, iterate through it.
for slice_ in history:
    for continuous_contract_symbol, chain in slice_.futures_chains.items():
        for contract in chain:
            pass
To convert the FutureHistory object to a DataFrame that contains the trade and quote information of each contract, use the data_frame property.
history.data_frame
| askclose | askhigh | asklow | askopen | asksize | bidclose | bidhigh | bidlow | bidopen | bidsize | close | high | low | open | volume | |||
|---|---|---|---|---|---|---|---|---|---|---|---|---|---|---|---|---|---|
| expiry | symbol | time | |||||||||||||||
| 2025-06-20 | ES YTG30NVEFCW1 | 2025-04-01 09:31:00 | 5631.50 | 5639.75 | 5631.50 | 5639.00 | 19.0 | 5631.25 | 5639.50 | 5631.25 | 5638.75 | 24.0 | 5631.25 | 5639.75 | 5631.25 | 5638.75 | 11661.0 |
| 2025-04-01 09:32:00 | 5629.00 | 5634.00 | 5628.00 | 5631.50 | 23.0 | 5628.75 | 5633.75 | 5627.75 | 5631.25 | 1.0 | 5629.00 | 5633.75 | 5627.75 | 5631.25 | 7613.0 | ||
| 2025-04-01 09:33:00 | 5636.25 | 5638.25 | 5628.25 | 5629.00 | 41.0 | 5636.00 | 5638.00 | 5628.00 | 5628.75 | 10.0 | 5636.00 | 5638.00 | 5628.25 | 5629.00 | 6543.0 | ||
| ... | ... | ... | ... | ... | ... | ... | ... | ... | ... | ... | ... | ... | ... | ... | ... | ... | ... |
| 2025-09-19 | ES YVXOP65RE0HT | 2025-04-02 16:58:00 | 5631.25 | 5638.50 | 5630.00 | 5637.25 | 1.0 | 5629.00 | 5636.00 | 5627.25 | 5635.00 | 2.0 | 5634.00 | 5635.00 | 5634.00 | 5635.00 | 3.0 |
| 2025-04-02 16:59:00 | 5625.75 | 5636.00 | 5624.00 | 5631.25 | 1.0 | 5623.50 | 5632.75 | 5620.75 | 5629.00 | 2.0 | 5627.00 | 5627.00 | 5627.00 | 5627.00 | 1.0 | ||
| 2025-04-02 17:00:00 | 5633.25 | 5634.50 | 5625.75 | 5625.75 | 1.0 | 5630.50 | 5632.00 | 5623.50 | 5623.50 | 1.0 | 5628.75 | 5628.75 | 5626.75 | 5626.75 | 36.0 |
To get the expiration dates of all the contracts in a FutureHistory object, call the get_expiry_dates method.
expiries = history.get_expiry_dates()
Continuous Price History
To get historical trade, quote, or tick data for the continuous contract, use the symbol property of the Future object when you make the history request.
# Get the daily TradeBar objects of the continuous contract.
history = qb.history(TradeBar, future.symbol, datetime(2025, 1, 1), datetime(2025, 4, 1), Resolution.DAILY)
| close | high | low | open | volume | |||
|---|---|---|---|---|---|---|---|
| expiry | symbol | time | |||||
| 1899-12-30 | /ES | 2025-01-02 17:00:00 | 5972.236830 | 6037.810377 | 5926.587554 | 6020.408166 | 1496415.0 |
| 2025-01-03 17:00:00 | 6038.062583 | 6049.664056 | 5986.360364 | 5997.457425 | 1009229.0 | ||
| 2025-01-06 17:00:00 | 6081.442006 | 6121.794957 | 6056.978029 | 6085.981713 | 1207465.0 | ||
| 2025-01-07 17:00:00 | 6007.293457 | 6098.844216 | 5987.369187 | 6095.313333 | 1543464.0 | ||
| 2025-01-08 17:00:00 | 6007.293457 | 6024.443462 | 5969.210359 | 6006.536839 | 1436052.0 | ||
| ... | ... | ... | ... | ... | ... | ||
| 2025-03-25 17:00:00 | 5832.000000 | 5837.250000 | 5809.500000 | 5826.000000 | 842430.0 | ||
| 2025-03-26 17:00:00 | 5754.750000 | 5834.500000 | 5743.000000 | 5824.000000 | 1269497.0 | ||
| 2025-03-27 17:00:00 | 5741.250000 | 5779.750000 | 5720.000000 | 5742.750000 | 1287285.0 | ||
| 2025-03-28 17:00:00 | 5602.500000 | 5731.250000 | 5602.250000 | 5723.500000 | 1595221.0 | ||
| 2025-03-31 17:00:00 | 5644.500000 | 5672.750000 | 5533.750000 | 5563.500000 | 1766518.0 |
Daily Prices History
To get daily data on all the tradable contracts for a given date, call the history method with the FutureUniverse type and the continuous contract Symbol.
If you pass flatten=True, this method returns a DataFrame with columns for the data point attributes.
The result contains the entire Futures chain for each trading day, not the subset of contracts that pass your universe filter.
The daily Futures chains contain the prices, volume, and open interest.
# Get the daily contract objects during Q1 2025.
history = qb.history(FutureUniverse, future.symbol, datetime(2025, 1, 1), datetime(2025, 4, 1), flatten=True)
| close | high | low | open | openinterest | value | volume | ||
|---|---|---|---|---|---|---|---|---|
| time | symbol | |||||||
| 2025-01-03 | ES YQYHC5L1GPA9 | 5920.000 | 5985.000 | 5874.750 | 5967.750 | 2068557.0 | 5920.000 | 1496415.0 |
| ES YTG30NVEFCW1 | 5975.750 | 6037.500 | 5930.000 | 6018.750 | 7388.0 | 5975.750 | 1305.0 | |
| ES YVXOP65RE0HT | 6030.250 | 6030.250 | 6000.000 | 6017.750 | 393.0 | 6030.250 | 13.0 | |
| ES YYFADOG4CO3L | 6086.625 | 6185.750 | 5938.875 | 6133.375 | 1152.0 | 6086.625 | 0.0 | |
| ES Z0WW26QHBBPD | 6139.000 | 6187.375 | 6113.375 | 6187.375 | 0.0 | 6139.000 | 0.0 | |
| ... | ... | ... | ... | ... | ... | ... | ... | ... |
| 2025-03-29 | ES Z0WW26QHBBPD | 5750.000 | 5750.000 | 5750.000 | 5750.000 | 6.0 | 5750.000 | 1.0 |
| ES Z3EHQP0U9ZB5 | 0.000 | 0.000 | 0.000 | 0.000 | 0.0 | 0.000 | 0.0 | |
| 2025-04-01 | ES YTG30NVEFCW1 | 5644.500 | 5672.750 | 5533.750 | 5563.500 | 2082053.0 | 5644.500 | 1766518.0 |
| ES YVXOP65RE0HT | 5691.750 | 5719.750 | 5580.000 | 5612.000 | 7042.0 | 5691.750 | 632.0 | |
| ES YYFADOG4CO3L | 5735.000 | 5821.125 | 5617.750 | 5654.250 | 2540.0 | 5735.000 | 0.0 |
# Select the contract with the largest open interest each day.
most_oi = history.groupby('time').apply(lambda x: x.nlargest(1, 'openinterest')).reset_index(level=1, drop=True).openinterest
time        symbol
2025-01-03  ES YQYHC5L1GPA9    2068557.0
2025-01-04  ES YQYHC5L1GPA9    2068557.0
2025-01-07  ES YQYHC5L1GPA9    2048207.0
2025-01-08  ES YQYHC5L1GPA9    2058863.0
2025-01-09  ES YQYHC5L1GPA9    2047807.0
                                 ...
2025-03-26  ES YTG30NVEFCW1    2086227.0
2025-03-27  ES YTG30NVEFCW1    2064932.0
2025-03-28  ES YTG30NVEFCW1    2070698.0
2025-03-29  ES YTG30NVEFCW1    2064619.0
2025-04-01  ES YTG30NVEFCW1    2082053.0
Name: openinterest, Length: 62, dtype: float64
If you intend to use the data in the DataFrame to create FutureUniverse objects, request that the history request returns the data type you need.
Otherwise, LEAN consumes unnecessary computational resources populating the DataFrame.
To get a list of FutureUniverse objects instead of a DataFrame, call the history[FutureUniverse] method.
# Get the 5 trailing daily FutureUniverse objects in FutureUniverse format.
history = qb.history[FutureUniverse](future.symbol, 5, Resolution.DAILY)
# Iterate through the FutureUniverse objects and access their volumes.
for future_universe in history:
    t = future_universe.end_time
    most_oi = sorted(future_universe, key=lambda contract: contract.open_interest)[-1]
The method represents each contract with an FutureUniverse object, which have the following properties:
Examples
The following examples demonstrate some common practices for applying the Futures dataset.
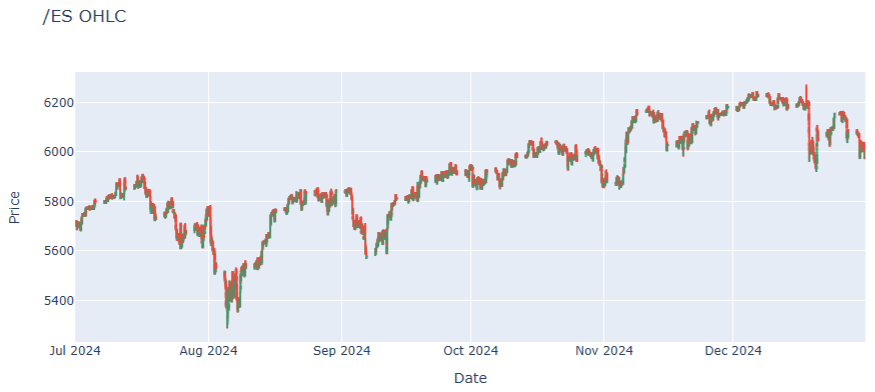
Example 1: 5-Minute Candlestick Plot
The following example studies the candlestick pattern of the ES Future. To study the short term pattern, we consolidate the data into 5 minute bars and plot the 5-minute candlestick plot.
# Import plotly library for plotting.
import plotly.graph_objects as go

# Create a QuantBook
qb = QuantBook()

# Request the continuous future historical data.
# Use raw normalization mode to fairly compare the actual bid and ask dollar volume.
future = qb.add_future(Futures.Indices.SP_500_E_MINI)
history = qb.history(
    future.symbol,
    start=datetime(2024, 7, 1),
    end=datetime(2025, 1, 1),
    resolution=Resolution.MINUTE,
    fill_forward=True,
    extended_market_hours=True,
    data_mapping_mode=DataMappingMode.OPEN_INTEREST,
    data_normalization_mode=DataNormalizationMode.BACKWARDS_RATIO,
    contract_depth_offset=0
)

# Drop level 0, 1 index (Symbol index) from the DataFrame
history = history.droplevel([0, 1])

# Select the required columns to obtain the 5-minute OHLC data.
history = history[["open", "high", "low", "close"]].resample("5T").agg({
    "open": "first",
    "high": "max",
    "low": "min",
    "close": "last"
})

# Crete the Candlestick chart using the 5-minute windows.
candlestick = go.Candlestick(
    x=history.index,
    open=history['open'],
    high=history['high'],
    low=history['low'],
    close=history['close']
)
# Create a Layout as the plot settings.
layout = go.Layout(
    title=go.layout.Title(text=f'{future.symbol} OHLC'),
    xaxis_title='Date',
    yaxis_title='Price',
    xaxis_rangeslider_visible=False
)
# Create the Figure.
fig = go.Figure(data=[candlestick], layout=layout)
# Display the plot.
fig.show()
You can also see our Videos. You can also get in touch with us via Discord.
Did you find this page helpful?