
Indicators
Custom Indicators
Create Subscriptions
You need to subscribe to some market data in order to calculate indicator values.
qb = QuantBook()
symbol = qb.add_equity("SPY").symbol
Create Indicator Timeseries
You need to subscribe to some market data in order to calculate a timeseries of indicator values.
Follow these steps to create an indicator timeseries:
- Get some historical data.
- Define a custom indicator class. Note the
PythonIndicatorsuperclass inheritance,Valueattribute, andupdatemethod are mandatory. - Initialize a new instance of the custom indicator.
- Create a
RollingWindowfor each attribute of the indicator to hold their values. - Attach a handler method to the indicator that updates the
RollingWindowobjects. - Iterate through the historical market data and update the indicator.
- Populate a
DataFramewith the data in theRollingWindowobjects.
# Request historical trading data with the daily resolution.
history = qb.history[TradeBar](symbol, 70, Resolution.DAILY)
In this tutorial, create an ExpectedShortfallPercent indicator that uses Monte Carlo to calculate the expected shortfall of returns.
class ExpectedShortfallPercent(PythonIndicator):
    import math, numpy as np

    def __init__(self, period, alpha):
        self.value = None   # Attribute represents the indicator value
        self.value_at_risk = None

        self.alpha = alpha

        self._window = RollingWindow[float](period)

    # Override the IsReady attribute to flag all attributes values are ready.
    @property
    def is_ready(self) -> bool:
        return self.value and self.value_at_risk

    # Method to update the indicator values. Note that it only receives 1 IBaseData object (Tick, TradeBar, QuoteBar) argument.
    def update(self, input: BaseData) -> bool:
        count = self._window.Count

        self._window.Add(input.Close)

        # Update the Value and other attributes as the indicator current value.
        if count >= 2:
            cutoff = math.ceil(self.alpha * count)

            ret = [ (self._window[i] - self._window[i+1]) / self._window[i+1] for i in range(count-1) ]
            lowest = sorted(ret)[:cutoff]

            self.value = np.mean(lowest)
            self.value_at_risk = lowest[-1]

        # return a boolean to indicate IsReady.
        return count >= 2
custom = ExpectedShortfallPercent(50, 0.05)
In this example, save 20 data points.
# Create a window dictionary to store RollingWindow objects.
window = {}
# Store the RollingWindow objects, index by key is the property of the indicator.
window['time'] = RollingWindow[DateTime](20)
window['expectedshortfall'] = RollingWindow[float](20)
window['valueatrisk'] = RollingWindow[float](20)
When the indicator receives new data, the preceding handler method adds the new IndicatorDataPoint values into the respective RollingWindow.
for bar in history:
    custom.update(bar)

    # The Updated event handler is not available for custom indicator in Python, RollingWindows are needed to be updated in here.
    if custom.is_ready:
        window['time'].add(bar.end_time)
        window['expectedshortfall'].add(custom.value)
        window['valueatrisk'].add(custom.value_at_risk)
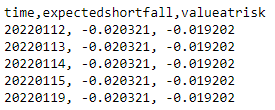
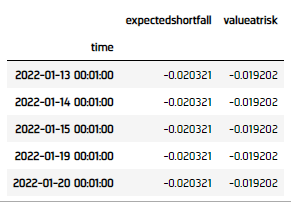
custom_dataframe = pd.DataFrame(window).set_index('time')
Examples
The following examples demonstrate some common practices for researching with combining indicators.
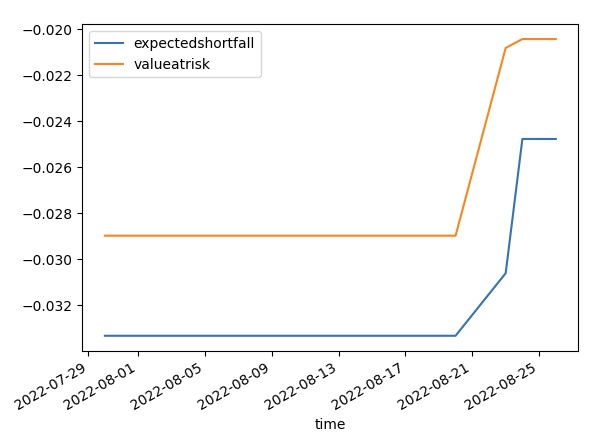
Example 1: Expected Shortfall
The following example demonstrates researching using a custom-constructed Expected Shortfall indicator. Expected Shortfall refers to the average of the N% worst-case return.
# Instantiate the QuantBook instance for researching.
qb = QuantBook()
# Request SPY data to work with the indicator.
symbol = qb.add_equity("SPY").symbol

# Request historical trading data with the daily resolution.
history = qb.history[TradeBar](symbol, 70, Resolution.DAILY)

class ExpectedShortfallPercent(PythonIndicator):
    import math, numpy as np

    def __init__(self, period, alpha):
        self.value = None   # Attribute represents the indicator value
        self.value_at_risk = None

        self.alpha = alpha

        self._window = RollingWindow[float](period)

    # Override the IsReady attribute to flag all attributes values are ready.
    @property
    def is_ready(self) -> bool:
        return self.value and self.value_at_risk

    # Method to update the indicator values. Note that it only receives 1 IBaseData object (Tick, TradeBar, QuoteBar) argument.
    def update(self, input: BaseData) -> bool:
        count = self._window.Count

        self._window.Add(input.Close)

        # Update the Value and other attributes as the indicator current value.
        if count >= 2:
            cutoff = math.ceil(self.alpha * count)

            ret = [ (self._window[i] - self._window[i+1]) / self._window[i+1] for i in range(count-1) ]
            lowest = sorted(ret)[:cutoff]

            self.value = np.mean(lowest)
            self.value_at_risk = lowest[-1]

        # return a boolean to indicate IsReady.
        return count >= 2

# Initialize a new instance of the custom indicator.
custom = ExpectedShortfallPercent(50, 0.05)

# Create a window dictionary to store RollingWindow objects.
window = {}
# Store the RollingWindow objects, index by key is the property of the indicator.
window['time'] = RollingWindow[DateTime](20)
window['expectedshortfall'] = RollingWindow[float](20)
window['valueatrisk'] = RollingWindow[float](20)

# Iterate through the historical market data and update the indicator.
for bar in history:
    custom.update(bar)

    # The Updated event handler is not available for custom indicator in Python, RollingWindows are needed to be updated in here.
    if custom.is_ready:
        window['time'].add(bar.end_time)
        window['expectedshortfall'].add(custom.value)
        window['valueatrisk'].add(custom.value_at_risk)

# Populate a DataFrame with the data in the RollingWindow objects.
custom_dataframe = pd.DataFrame(window).set_index('time')

# Create line chart of the Expected Shortfall Percent.
custom_dataframe.plot(title=f"Expected Shortfall Percent of {symbol}", xlabel="Time", ylabel="%")
plt.show()
You can also see our Videos. You can also get in touch with us via Discord.
Did you find this page helpful?