
Applying Research
Mean Reversion
Create Hypothesis
Imagine that we've developed the following hypothesis: stocks that are below 1 standard deviation of their 30-day-mean are due to revert and increase in value, statistically around 85% chance if we assume the return series is stationary and the price series is a Random Process. We've developed the following code in research to pick out such stocks from a preselected basket of stocks.
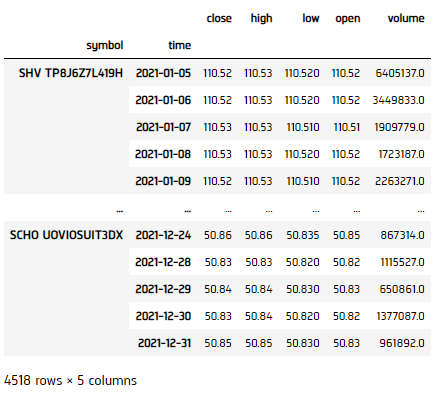
Get Historical Data
To begin, we retrieve historical data for researching.
- Instantiate a
QuantBook. - Select the desired tickers for research.
- Call the
add_equitymethod with the tickers, and their corresponding resolution. - Call the
historymethod withqb.securities.keysfor all tickers, time argument(s), and resolution to request historical data for the symbol.
qb = QuantBook()
assets = ["SHY", "TLT", "SHV", "TLH", "EDV", "BIL",
          "SPTL", "TBT", "TMF", "TMV", "TBF", "VGSH", "VGIT",
          "VGLT", "SCHO", "SCHR", "SPTS", "GOVT"]
for i in range(len(assets)):
    qb.add_equity(assets[i],Resolution.MINUTE)
If you do not pass a resolution argument, Resolution.MINUTE is used by default.
history = qb.history(qb.securities.keys(), datetime(2021, 1, 1), datetime(2021, 12, 31), Resolution.DAILY)
Prepare Data
We'll have to process our data to get an extent of the signal on how much the stock is deviated from its norm for each ticker.
- Select the close column and then call the
unstackmethod. - Calculate the truth value of the most recent price being less than 1 standard deviation away from the mean price.
- Get the z-score for the True values, then compute the expected return and probability (used for Insight magnitude and confidence).
- Call
fillnato fill NaNs with 0. - Get our trading weight, we'd take a long only portfolio and normalized to total weight = 1.
df = history['close'].unstack(level=0)
classifier = df.le(df.rolling(30).mean() - df.rolling(30).std())
z_score = df.apply(zscore)[classifier]
magnitude = -z_score * df.rolling(30).std() / df.shift(1)
confidence = (-z_score).apply(norm.cdf)
magnitude.fillna(0, inplace=True)
confidence.fillna(0, inplace=True)
weight = confidence - 1 / (magnitude + 1)
weight = weight[weight > 0].fillna(0)
sum_ = np.sum(weight, axis=1)
for i in range(weight.shape[0]):
    if sum_[i] > 0:
        weight.iloc[i] = weight.iloc[i] / sum_[i]
    else:
        weight.iloc[i] = 0
weight = weight.iloc[:-1]
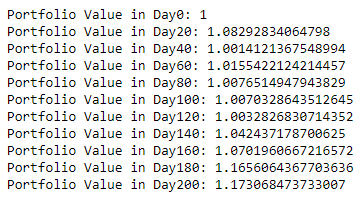
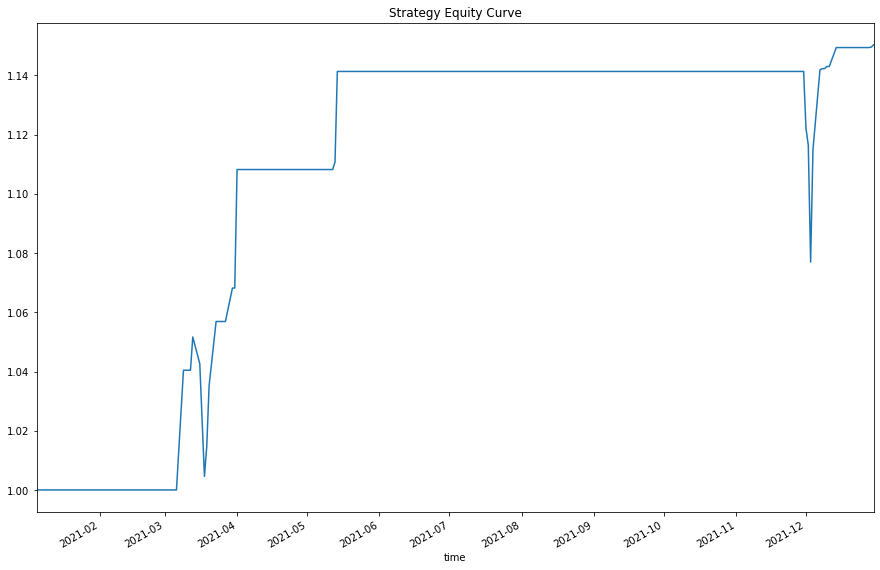
Test Hypothesis
We would test the performance of this strategy. To do so, we would make use of the calculated weight for portfolio optimization.
- Get the total daily return series.
- Call
cumprodto get the cumulative return. - Set index for visualization.
- Display the result.
ret = pd.Series(index=range(df.shape[0] - 1))
for i in range(df.shape[0] - 1):
    ret[i] = weight.iloc[i] @ df.pct_change().iloc[i + 1].T
total_ret = (ret + 1).cumprod()
total_ret.index = weight.index
total_ret.plot(title='Strategy Equity Curve', figsize=(15, 10))
plt.show()
Set Up Algorithm
Once we are confident in our hypothesis, we can export this code into backtesting. One way to accomodate this model into research is to create a scheduled event which uses our model to pick stocks and goes long.
def initialize(self) -> None:

    #1. Required: Five years of backtest history
    self.set_start_date(2014, 1, 1)

    #2. Required: Alpha Streams Models:
    self.set_brokerage_model(BrokerageName.ALPHA_STREAMS)

    #3. Required: Significant AUM Capacity
    self.set_cash(1000000)

    #4. Required: Benchmark to SPY
    self.set_benchmark("SPY")

    self.set_portfolio_construction(InsightWeightingPortfolioConstructionModel())
    self.set_execution(ImmediateExecutionModel())

    self.assets = ["SHY", "TLT", "IEI", "SHV", "TLH", "EDV", "BIL",
                    "SPTL", "TBT", "TMF", "TMV", "TBF", "VGSH", "VGIT",
                    "VGLT", "SCHO", "SCHR", "SPTS", "GOVT"]

    # Add Equity ------------------------------------------------
    for i in range(len(self.assets)):
        self.add_equity(self.assets[i], Resolution.MINUTE)

    # Set Scheduled Event Method For Our Model
    self.schedule.on(self.date_rules.every_day(), self.time_rules.before_market_close("SHY", 5), self.every_day_before_market_close)
Now we export our model into the scheduled event method. We will switch qb with self and replace methods with their QCAlgorithm counterparts as needed. In this example, this is not an issue because all the methods we used in research also exist in QCAlgorithm.
def every_day_before_market_close(self) -> None:
    qb = self
    # Fetch history on our universe
    df = qb.history(list(qb.securities.keys()), 30, Resolution.DAILY)
    if df.empty: return

    # Make all of them into a single time index.
    df = df.close.unstack(level=0)

    # Calculate the truth value of the most recent price being less than 1 std away from the mean
    classifier = df.le(df.mean().subtract(df.std())).iloc[-1]
    if not classifier.any(): return

    # Get the z-score for the True values, then compute the expected return and probability
    z_score = df.apply(zscore)[[classifier.index[i] for i in range(classifier.size) if classifier.iloc[i]]]

    magnitude = -z_score * df.std() / df
    confidence = (-z_score).apply(norm.cdf)

    # Get the latest values
    magnitude = magnitude.iloc[-1].fillna(0)
    confidence = confidence.iloc[-1].fillna(0)

    # Get the weights, then zip together to iterate over later
    weight = confidence - 1 / (magnitude + 1)
    weight = weight[weight > 0].fillna(0)
    sum_ = np.sum(weight)
    if sum_ > 0:
        weight = (weight) / sum_
        selected = zip(weight.index, magnitude, confidence, weight)
    else:
        return

    # ==============================

    insights = []

    for symbol, magnitude, confidence, weight in selected:
        insights.append( Insight.price(symbol, timedelta(days=1), InsightDirection.UP, magnitude, confidence, None, weight) )

    self.emit_insights(insights)
Examples
The below code snippets concludes the above jupyter research notebook content.
from scipy.stats import norm, zscore

# Instantiate a QuantBook.
qb = QuantBook()

# Select the desired tickers for research.
symbols = {}
assets = ["SHY", "TLT", "SHV", "TLH", "EDV", "BIL",
          "SPTL", "TBT", "TMF", "TMV", "TBF", "VGSH", "VGIT",
          "VGLT", "SCHO", "SCHR", "SPTS", "GOVT"]

# Call the AddEquity method with the tickers, and its corresponding resolution. Then store their Symbols. Resolution.Minute is used by default.
for i in range(len(assets)):
    symbols[assets[i]] = qb.add_equity(assets[i], Resolution.MINUTE).symbol

# Call the History method with qb.Securities.Keys for all tickers, time argument(s), and resolution to request historical data for the symbol.
history = qb.history(qb.securities.Keys, datetime(2021, 1, 1), datetime(2021, 12, 31), Resolution.DAILY)

# Select the close column and then call the unstack method.
df = history['close'].unstack(level=0)

# Calculate the truth value of the most recent price being less than 1 standard deviation away from the mean price.
classifier = df.le(df.rolling(30).mean() - df.rolling(30).std())

# Get the z-score for the True values, then compute the expected return and probability (used for Insight magnitude and confidence).
z_score = df.apply(zscore)[classifier]
magnitude = -z_score * df.rolling(30).std() / df
confidence = (-z_score).apply(norm.cdf)

# Call fillna to fill NaNs with 0
magnitude.fillna(0, inplace=True)
confidence.fillna(0, inplace=True)

# Get our trading weight, we'd take a long only portfolio and normalized to total weight = 1
weight = confidence - 1 / (magnitude + 1)
weight = weight[weight > 0].fillna(0)
sum_ = np.sum(weight, axis=1)
for i in range(weight.shape[0]):
    if sum_[i] > 0:
        weight.iloc[i] = weight.iloc[i] / sum_[i]
    else:
        weight.iloc[i] = 0
weight = weight.iloc[:-1]

# Get the total daily return series
ret = pd.Series(index=range(df.shape[0] - 1))
for i in range(df.shape[0] - 1):
    ret[i] = weight.iloc[i] @ df.pct_change().iloc[i + 1].T

# Call cumprod to get the cumulative return
total_ret = (ret + 1).cumprod()

# Set index for visualization
total_ret.index = weight.index

# Plot the result
total_ret.plot(title='Strategy Equity Curve', figsize=(15, 10))
plt.show()
The below code snippets concludes the algorithm set up.
from scipy.stats import norm, zscore

class MeanReversionDemo(QCAlgorithm):

    def initialize(self) -> None:
        #1. Required: Five years of backtest history
        self.set_start_date(2014, 1, 1)

        #2. Required: Alpha Streams Models:
        self.set_brokerage_model(BrokerageName.ALPHA_STREAMS)

        #3. Required: Significant AUM Capacity
        self.set_cash(1000000)

        #4. Required: Benchmark to SPY
        self.set_benchmark("SPY")

        self.set_portfolio_construction(InsightWeightingPortfolioConstructionModel())
        self.set_execution(ImmediateExecutionModel())

        self.assets = ["SHY", "TLT", "IEI", "SHV", "TLH", "EDV", "BIL",
                        "SPTL", "TBT", "TMF", "TMV", "TBF", "VGSH", "VGIT",
                        "VGLT", "SCHO", "SCHR", "SPTS", "GOVT"]

        # Add Equity ------------------------------------------------
        for i in range(len(self.assets)):
            self.add_equity(self.assets[i], Resolution.MINUTE).symbol

        # Set Scheduled Event Method For Our Model
        self.schedule.on(self.date_rules.every_day(), self.time_rules.before_market_close("SHY", 5), self.every_day_before_market_close)


    def every_day_before_market_close(self) -> None:
        qb = self
        # Fetch history on our universe
        df = qb.history(list(qb.securities.keys()), 30, Resolution.DAILY)
        if df.empty: return

        # Make all of them into a single time index.
        df = df.close.unstack(level=0)

        # Calculate the truth value of the most recent price being less than 1 std away from the mean
        classifier = df.le(df.mean().subtract(df.std())).iloc[-1]
        if not classifier.any(): return

        # Get the z-score for the True values, then compute the expected return and probability
        z_score = df.apply(zscore)[[classifier.index[i] for i in range(classifier.size) if classifier.iloc[i]]]

        magnitude = -z_score * df.std() / df
        confidence = (-z_score).apply(norm.cdf)

        # Get the latest values
        magnitude = magnitude.iloc[-1].fillna(0)
        confidence = confidence.iloc[-1].fillna(0)

        # Get the weights, then zip together to iterate over later
        weight = confidence - 1 / (magnitude + 1)
        weight = weight[weight > 0].fillna(0)
        sum_ = np.sum(weight)
        if sum_ > 0:
            weight = (weight) / sum_
            selected = zip(weight.index, magnitude, confidence, weight)
        else:
            return

        # ==============================

        insights = []

        for symbol, magnitude, confidence, weight in selected:
            insights.append( Insight.price(symbol, timedelta(days=1), InsightDirection.UP, magnitude, confidence, None, weight) )

        self.emit_insights(insights)
You can also see our Videos. You can also get in touch with us via Discord.
Did you find this page helpful?