Asset Classes
US Equities
Trades
To get historical trade data, call the History<TradeBar> method with an asset's Symbol.
To get historical trade data, call the history method with the TradeBar type and an asset's Symbol.
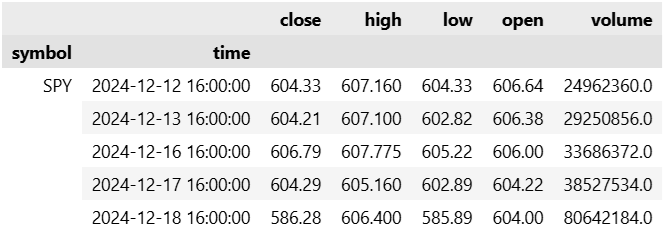
This method returns a DataFrame with columns for the open, high, low, close, and volume.
public class USEquityTradeBarHistoryAlgorithm : QCAlgorithm
{
    public override void Initialize()
    {
        SetStartDate(2024, 12, 19);
        // Get the Symbol of an asset.
        var symbol = AddEquity("SPY").Symbol;
        // Get the 5 trailing daily TradeBar objects of the asset.
        var history = History<TradeBar>(symbol, 5, Resolution.Daily);
        // Iterate through each TradeBar and calculate its dollar volume.
        foreach (var bar in history)
        {
            var t = bar.EndTime;
            var dollarVolume = bar.Close * bar.Volume;
        }
    }
}
class USEquityTradeBarHistoryAlgorithm(QCAlgorithm):
def initialize(self) -> None:
self.set_start_date(2024, 12, 19)
# Get the Symbol of an asset.
symbol = self.add_equity('SPY').symbol
# Get the 5 trailing daily TradeBar objects of the asset in DataFrame format.
history = self.history(TradeBar, symbol, 5, Resolution.DAILY)
# Calculate the daily returns.
daily_returns = history.close.pct_change().iloc[1:]
symbol  time
SPY     2024-12-13 16:00:00   -0.000199
        2024-12-16 16:00:00    0.004270
        2024-12-17 16:00:00   -0.004120
        2024-12-18 16:00:00   -0.029804
Name: close, dtype: float64
If you request a DataFrame, LEAN unpacks the data from Slice objects to populate the DataFrame.
If you intend to use the data in the DataFrame to create TradeBar objects, request that the history request returns the data type you need.
Otherwise, LEAN will consume computational resources populating the DataFrame.
To get a list of TradeBar objects instead of a DataFrame, call the history[TradeBar] method.
# Get the 5 trailing daily TradeBar objects of an asset in TradeBar format.
history = self.history[TradeBar](symbol, 5, Resolution.DAILY)
# Iterate through the TradeBar objects and access their volumes.
for trade_bar in history:
    volume = trade_bar.volume
Quotes
To get historical quote data, call the History<QuoteBar> method with an asset's Symbol.
To get historical quote data, call the history method with the QuoteBar type and an asset's Symbol.
This method returns a DataFrame with columns for the open, high, low, close, and size of the bid and ask quotes.
The columns that don't start with "bid" or "ask" are the mean of the quote prices on both sides of the market.
public class USEquityQuoteBarAlgorithm : QCAlgorithm
{
    public override void Initialize()
    {
        SetStartDate(2024, 12, 19);
        // Get the Symbol of an asset.
        var symbol = AddEquity("SPY").Symbol;
        // Get the 5 trailing minute QuoteBar objects of the asset.
        var history = History<QuoteBar>(symbol, 5, Resolution.Minute);
        // Iterate through the QuoteBar objects and calculate the spread.
        foreach (var bar in history)
        {
            var t = bar.EndTime;
            var spread = bar.Ask.Close - bar.Bid.Close;
        }
    }
}
class USEquityQuoteBarAlgorithm(QCAlgorithm):
def initialize(self) -> None:
self.set_start_date(2024, 12, 19)
# Get the Symbol of an asset.
symbol = self.add_equity('SPY').symbol
# Get the 5 trailing minute QuoteBar objects of the asset in DataFrame format.
history = self.history(QuoteBar, symbol, 5, Resolution.MINUTE)

# Calculate the spread at each minute.
spread = history.askclose - history.bidclose
symbol  time
SPY     2024-12-18 15:56:00    0.039866
        2024-12-18 15:57:00    0.029899
        2024-12-18 15:58:00    0.019933
        2024-12-18 15:59:00    0.009966
        2024-12-18 16:00:00    0.029899
dtype: float64
If you request a DataFrame, LEAN unpacks the data from Slice objects to populate the DataFrame.
If you intend to use the data in the DataFrame to create QuoteBar objects, request that the history request returns the data type you need.
Otherwise, LEAN will consume computational resources populating the DataFrame.
To get a list of QuoteBar objects instead of a DataFrame, call the history[QuoteBar] method.
# Get the 5 trailing minute QuoteBar objects of an asset in QuoteBar format.
history = self.history[QuoteBar](symbol, 5, Resolution.MINUTE)
# Iterate through each QuoteBar and calculate the dollar volume on the bid.
for quote_bar in history:
    bid_dollar_volume = quote_bar.last_bid_size * quote_bar.bid.close
The resolution of data you request must support QuoteBar data. Otherwise, the history request won't return any data. To check which resolutions for US Equities support QuoteBar data, see Resolutions.
Ticks
To get historical tick data, call the History<Tick> method with an asset's Symbol and Resolution.Tick.
This history request works when you request ticks over a trailing period of time or between start and end times.
To get historical tick data, call the history method with an asset's Symbol and Resolution.TICK.
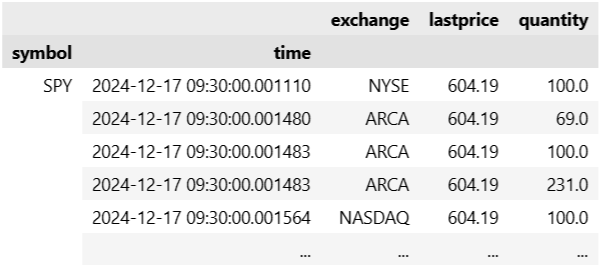
This method returns a DataFrame that contains data on bids, asks, and trades.
public class USEquityTickHistoryAlgorithm : QCAlgorithm
{
    public override void Initialize()
    {
        SetStartDate(2024, 12, 19);
        // Get the Symbol of an asset.
        var symbol = AddEquity("SPY").Symbol;
        // Get the trailing 2 days of ticks for the asset.
        var history = History<Tick>(symbol, TimeSpan.FromDays(2), Resolution.Tick);
        // Select the ticks that represent trades, excluding the quote ticks.
        var trades = history.Where(tick => tick.TickType == TickType.Trade);
    }
}
class USEquityTickHistoryAlgorithm(QCAlgorithm):
def initialize(self) -> None:
self.set_start_date(2024, 12, 19)
# Get the Symbol of an asset.
symbol = self.add_equity('SPY').symbol
# Get the trailing 2 days of ticks for the asset in DataFrame format.
history = self.history(symbol, timedelta(2), Resolution.TICK)

# Select the rows in the DataFrame that represent trades. Drop the bid/ask columns since they are NaN.
trade_ticks = history[history.quantity > 0].dropna(axis=1)
If you request a DataFrame, LEAN unpacks the data from Slice objects to populate the DataFrame.
If you intend to use the data in the DataFrame to create Tick objects, request that the history request returns the data type you need.
Otherwise, LEAN will consume computational resources populating the DataFrame.
To get a list of Tick objects instead of a DataFrame, call the history[Tick] method.
# Get the trailing 2 days of ticks for an asset in Tick format.
history = self.history[Tick](symbol, timedelta(2), Resolution.TICK)
# Iterate through each quote tick and calculate the quote size.
for tick in history:
    if tick.tick_type == TickType.Quote:
        size = max(tick.bid_size, tick.ask_size)
Tick history requests only accept a trailing period of time or start and end dates. These history requests don't work if you provide a period argument, requesting a specific number of trailing ticks.
Slices
To get historical Slice data, call the Historyhistory method without passing any Symbol objects.
This method returns Slice objects, which contain data points from all the datasets in your algorithm.
If you omit the resolution argument, it uses the resolution that you set for each security and dataset when you created the subscriptions.
public class SliceHistoryAlgorithm : QCAlgorithm
{
    public override void Initialize()
    {
        SetStartDate(2024, 12, 1);
        // Add some assets and datasets.
        AddEquity("SPY");
        // Get the historical Slice objects over the last 5 days for all the subcriptions in your algorithm.
        var history = History(5, Resolution.Daily);
        // Iterate through each historial Slice.
        foreach (var slice in history)
        {
            // Iterate through each TradeBar in this Slice.
            foreach (var kvp in slice.Bars)
            {
                var symbol = kvp.Key;
                var bar = kvp.Value;
            }
        }
    }
}
class SliceHistoryAlgorithm(QCAlgorithm):
def initialize(self) -> None:
self.set_start_date(2024, 12, 1)
# Add some assets and datasets.
self.add_equity('SPY')
# Get the historical Slice objects over the last 5 days for all the subcriptions in your algorithm.
history = self.history(5, Resolution.DAILY)
# Iterate through each Slice.
for slice_ in history:
# Iterate through each TradeBar in this Slice.
for symbol, trade_bar in slice_.bars.items():
close = trade_bar.close
Fundamentals
To get historical fundamental data, call the History<Fundamental> method with an asset's Symbol.
To get historical fundamental data, call the history method with the Fundamental type and an asset's Symbol.
This method returns a DataFrame with columns for the data point attributes.
public class USEquityFundamentalHistoryAlgorithm : QCAlgorithm
{
    public override void Initialize()
    {
        SetStartDate(2024, 12, 27);
        // Get the Symbol of an asset.
        var symbol = AddEquity("AAPL").Symbol;
        // Get the 3 trailing daily Fundamental objects of the asset.
        var history = History<Fundamental>(symbol, 3, Resolution.Daily);
        // Iterate through each Fundamental object.
        foreach (var fundamental in history)
        {
            var t = fundamental.EndTime;
            var currentRatio = fundamental.OperationRatios.CurrentRatio.Value;
        }
    }
}
class USEquityFundamentalHistoryAlgorithm(QCAlgorithm):
def initialize(self) -> None:
self.set_start_date(2024, 12, 27)
# Get the Symbol of an asset.
symbol = self.add_equity('AAPL').symbol
# Get the 3 trailing daily Fundamental objects of the asset in DataFrame format.
history = self.history(Fundamental, symbol, 3, Resolution.DAILY)

# Get the Current Ratio of each row.
current_ratios = history.apply(lambda row: row.operationratios.current_ratio.value, axis=1)
symbol  time
AAPL    2024-12-24    0.867313
        2024-12-25    0.867313
        2024-12-27    0.867313
dtype: float64
If you request a DataFrame, LEAN unpacks the data from Fundamental objects to populate the DataFrame.
To avoid consuming computational resources populating the DataFrame, you can instead request Fundamental objects.
To get a list of Fundamental objects, call the history[Fundamental] method.
# Get the 3 trailing daily Fundamental objects of an asset in Fundamental format.
history = self.history[Fundamental](symbol, 3, Resolution.DAILY)
# Iterate through each Fundamental object and access its properites.
for fundamental in history:
    symbol = fundamental.symbol
    pe_ratio = fundamental.valuation_ratios.pe_ratio
Splits
To get historical split data, call the History<Split> method with an asset's Symbol.
Splits are a sparse dataset, so use a time period history request since most days have no data.
To get historical split data, call the history method with the Split type and an asset's Symbol.
This method returns a DataFrame with columns for the reference price, split factor, and split type.
Splits are a sparse dataset, so use a time period history request since most days have no data.
public class USEquitySplitHistoryAlgorithm : QCAlgorithm
{
    public override void Initialize()
    {
        SetStartDate(2024, 12, 1);
        // Get the Symbol of an asset.
        var symbol = AddEquity("AAPL").Symbol;
        // Get the splits that occured for the stock over the last 5 years.
        var history = History<Split>(symbol, TimeSpan.FromDays(5*365));
        // Select the dates when splits occurred.
        var splitDates = history.Where(split => split.Type == SplitType.SplitOccurred).Select(split => split.EndTime);
    }
}
class USEquitySplitHistoryAlgorithm(QCAlgorithm):
def initialize(self) -> None:
self.set_start_date(2024, 12, 1)
# Get the Symbol of an asset.
symbol = self.add_equity('AAPL').symbol
# Get the splits that occured for the stock over the last 5 years in DataFrame format.
history = self.history(Split, symbol, timedelta(5*365))

In the preceding DataFrame, the type column represents the SplitType enumeration, where 0=SplitType.WARNING and 1=SplitType.SPLIT_OCCURRED.
# Select the prices where splits occurred.
split_prices = history[history.type == SplitType.SPLIT_OCCURRED].value
symbol  time
AAPL    2020-08-31    499.23
Name: value, dtype: float64
If you request a DataFrame, LEAN unpacks the data from Slice objects to populate the DataFrame.
If you intend to use the data in the DataFrame to create Split objects, request that the history request returns the data type you need.
Otherwise, LEAN will consume computational resources populating the DataFrame.
To get a list of Split objects instead of a DataFrame, call the history[Split] method.
# Get the splits that occured for a stock over the last 5 years in Split format.
history = self.history[Split](symbol, timedelta(5*365))
# Iterate through each Split object.
for split in history:
    # Select the time when each split occurred.
    if split.type == SplitType.SPLIT_OCCURRED:
        t = split.end_time
Dividends
To get historical dividend data, call the History<Dividend> method with an asset's Symbol.
Dividends are a sparse dataset, so use a time period history request since most days have no data.
To get historical dividend data, call the history method with the Dividend type and an asset's Symbol.
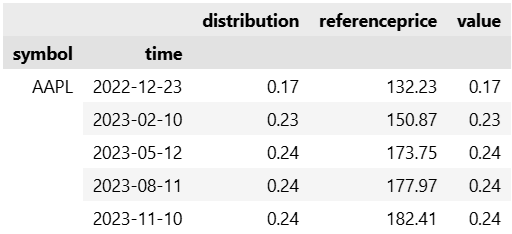
This method returns a DataFrame with columns for the dividend payment and reference price.
Dividends are a sparse dataset, so use a time period history request since most days have no data.
public class USEquityDividendHistoryAlgorithm : QCAlgorithm
{
    public override void Initialize()
    {
        SetStartDate(2024, 12, 1);
        // Get the Symbol of an asset.
        var symbol = AddEquity("AAPL").Symbol;
        // Get the dividends that the stock paid over the last 2 years.
        var history = History<Dividend>(symbol, TimeSpan.FromDays(2*365));
        // Calculate the mean dividend payment.
        var meanDividend = history.Average(split => split.Distribution);
    }
}
class USEquityDividendHistoryAlgorithm(QCAlgorithm):
def initialize(self) -> None:
self.set_start_date(2024, 12, 1)
# Get the Symbol of an asset.
symbol = self.add_equity('AAPL').symbol
# Get the dividends that the stock paid over the last 2 years in DataFrame format.
history = self.history(Dividend, symbol, timedelta(2*365))
# Calculate the mean dividend payment.
mean_dividend = history.distribution.mean()
If you request a DataFrame, LEAN unpacks the data from Slice objects to populate the DataFrame.
If you intend to use the data in the DataFrame to create Dividend objects, request that the history request returns the data type you need.
Otherwise, LEAN will consume computational resources populating the DataFrame.
To get a list of Dividend objects instead of a DataFrame, call the history[Dividend] method.
# Get the dividends that a stock paid over the last 2 years in Dividend format.
history = self.history[Dividend](symbol, timedelta(2*365))
# Iterate through each Dividend object.
for dividend in history:
    distribution = dividend.distribution
Symbol Changes
To get historical symbol change data, call the History<SymbolChangedEvent> method with an asset's Symbol.
To get historical symbol change data, call the history method with the SymbolChangedEvent type and an asset's Symbol.
This method returns a DataFrame with columns for the old symbol and new symbol during each change.
public class USEquitySymbolChangedEventHistoryAlgorithm : QCAlgorithm
{
    public override void Initialize()
    {
        SetStartDate(2024, 12, 1);
        // Get the Symbol of an asset.
        var symbol = AddEquity("META").Symbol;
        // Get the symbol changes of the stock over the last 10 years.
        var history = History<SymbolChangedEvent>(symbol, TimeSpan.FromDays(10*365));
        // Iterate through each SymbolChangedEvent object to access their data point attributes.
        foreach (var symbolChangedEvent in history)
        {
            var t = symbolChangedEvent.EndTime;
            var oldSymbol = symbolChangedEvent.OldSymbol;
            var newSymbol = symbolChangedEvent.NewSymbol;
        }
    }
}
class USEquitySymbolChangedEventHistoryAlgorithm(QCAlgorithm):
def initialize(self) -> None:
self.set_start_date(2024, 12, 1)
# Get the Symbol of an asset.
symbol = self.add_equity('META').symbol
# Get the symbol changes of the stock over the last 10 years in DataFrame format.
history = self.history(SymbolChangedEvent, symbol, timedelta(10*365))

# Select the dates of each ticker change.
dates = list(history.index.levels[1])
If you request a DataFrame, LEAN unpacks the data from Slice objects to populate the DataFrame.
If you intend to use the data in the DataFrame to create SymbolChangedEvent objects, request that the history request returns the data type you need.
Otherwise, LEAN will consume computational resources populating the DataFrame.
To get a list of SymbolChangedEvent objects instead of a DataFrame, call the history[SymbolChangedEvent] method.
# Get the symbol changes of a stock over the last 10 years in SymbolChangedEvent format.
history = self.history[SymbolChangedEvent](symbol, timedelta(10*365))
# Iterate through each SymbolChangedEvent object.
for symbol_changed_event in history:
    t = symbol_changed_event.end_time
    old_symbol = symbol_changed_event.old_symbol
    new_symbol = symbol_changed_event.new_symbol
Delistings
To get historical delisting data, call the History<Delisting> method with an asset's Symbol.
Delistings are a sparse dataset, so use a time period history request since most days have no data.
To get historical delisting data, call the history method with the Delisting type and an asset's Symbol.
This method returns a DataFrame with columns for the old symbol and new symbol during each change.
Delistings are a sparse dataset, so use a time period history request since most days have no data.
public class USEquityDelistingHistoryAlgorithm : QCAlgorithm
{
    public override void Initialize()
    {
        SetStartDate(2024, 12, 1);
        // Get the Symbol of an asset.
        var symbol = AddEquity("BBBY").Symbol;
        // Get the deslistings of the asset over the last 10 years.
        var history = History<Delisting>(symbol, TimeSpan.FromDays(10*365));
        // Get the dates of the delist warnings.
        var delistWarningDates = history
            .Where(delisting => delisting.Type == DelistingType.WARNING)
            .Select(delisting => delisting.EndTime);
    }
}
class USEquityDelistingHistoryAlgorithm(QCAlgorithm):
def initialize(self) -> None:
self.set_start_date(2024, 12, 1)
# Get the Symbol of an asset.
symbol = self.add_equity('BBBY').symbol
# Get the deslistings of the asset over the last 10 years in DataFrame format.
history = self.history(Delisting, symbol, timedelta(10*365))
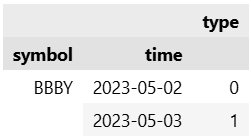
In the preceding DataFrame, the type column represents the DelistingType enumeration, where 0=DelistingType.WARNING and 1=DelistingType.DELISTED.
# Select the rows in the DataFrame that represent deslist warnings.
warnings = history[history.type == DelistingType.WARNING].type
symbol  time
BBBY    2023-05-02    0
Name: type, dtype: int64
If you request a DataFrame, LEAN unpacks the data from Slice objects to populate the DataFrame.
If you intend to use the data in the DataFrame to create Delisting objects, request that the history request returns the data type you need.
Otherwise, LEAN will consume computational resources populating the DataFrame.
To get a list of Delisting objects instead of a DataFrame, call the history[Delisting] method.
# Get the deslistings of an asset over the last 10 years in Delisting format.
history = self.history[Delisting](symbol, timedelta(10*365))
# Iterate through each Deslisting object and access the warning dates.
for deslisting in history:
    if deslisting.type == DelistingType.WARNING:
        warning_date = deslisting.end_time
Universes
To get historical universe data, call the History method with the Universe object.
To get historical universe data, call the history method with the Universe object.
This method returns a DataFrame with columns for the data point attributes.
public class USEquityUniverseHistoryAlgorithm : QCAlgorithm
{
    public override void Initialize()
    {
        SetStartDate(2024, 12, 23);
        // Add a universe of US Equities based on the constituents of an ETF.
        var universe = AddUniverse(Universe.ETF("SPY"));
        // Get 5 days of history for the universe.
        var history = History(universe, TimeSpan.FromDays(5));
        // Iterate through each day of the universe history.
        foreach (var constituents in history)
        {
            // Select the 2 assets with the smallest weights in the ETF on this day.
            var dailyLargest = constituents.Select(c => c as ETFConstituentData).OrderByDescending(c => c.Weight).Take(2);
        }
    }
}
class USEquityUniverseHistoryAlgorithm(QCAlgorithm):
def initialize(self) -> None:
self.set_start_date(2024, 12, 23)
# Add a universe of US Equities based on the constituents of an ETF.
universe = self.add_universe(self.universe.etf('SPY'))
# Get 5 days of history for the universe.
history = self.history(universe, timedelta(5), flatten=True)
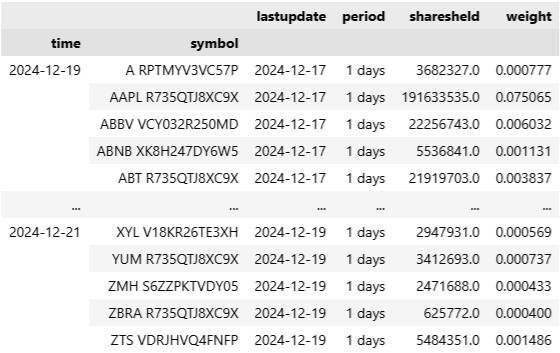
# Select the 2 assets with the smallest weights in the ETF each day.
daily_smallest = history.groupby('time').apply(lambda x: x.nsmallest(2, 'weight')).reset_index(level=1, drop=True).weight
time        symbol
2024-12-19  AMTMW YM37RIGZUD0L    0.000053
            NWSVV VHJF6S7EZRL1    0.000068
2024-12-20  AMTMW YM37RIGZUD0L    0.000051
            NWSVV VHJF6S7EZRL1    0.000069
2024-12-21  AMTMW YM37RIGZUD0L    0.000048
            NWSVV VHJF6S7EZRL1    0.000069
Name: weight, dtype: float64
To get the data in the format of the objects that you receive in your universe filter function instead of a DataFrame, use flatten=False.
# Get the historical universe data over the last 30 days in a Series where
# the values in the series are lists of the universe selection objects.
history = self.history(universe, timedelta(30), flatten=False)
# Iterate through each day of universe selection.
for (universe_symbol, end_time), constituents in history.items():
    # Select the 10 largest assets in the ETF on this day.
    largest = sorted(constituents, key=lambda c: c.weight)[-10:]
Alternative Data
To get historical alternative data, call the History<alternativeDataClass> method with the dataset Symbol.
To get historical alternative data, call the history method with the dataset Symbol.
This method returns a DataFrame that contains the data point attributes.
public class USEquityAlternativeDataHistoryAlgorithm : QCAlgorithm
{
    public override void Initialize()
    {
        SetStartDate(2024, 12, 19);
        // Get the Symbol of an asset.
        var symbol = AddEquity("GME").Symbol;
        // Add the alternative dataset and save a reference to its Symbol.
        var datasetSymbol = AddData<QuiverWallStreetBets>(symbol).Symbol;
        // Get the trailing 5 days of QuiverWallStreetBets data for the asset.
        var history = History<QuiverWallStreetBets>(datasetSymbol, 5, Resolution.Daily);
        // Iterate each data point and access its attributes.
        foreach (var dataPoint in history)
        {
            var t = dataPoint.EndTime;
            var sentiment = dataPoint.Sentiment;
        }
    }
}
class USEquityAlternativeDataHistoryAlgorithm(QCAlgorithm):
def initialize(self) -> None:
self.set_start_date(2024, 12, 19)
# Get the Symbol of an asset.
symbol = self.add_equity('GME').symbol
# Add the alternative dataset and save a reference to its Symbol.
dataset_symbol = self.add_data(QuiverWallStreetBets, symbol).symbol
# Get the trailing 5 days of QuiverWallStreetBets data for the asset in DataFrame format.
history = self.history(dataset_symbol, 5, Resolution.DAILY)
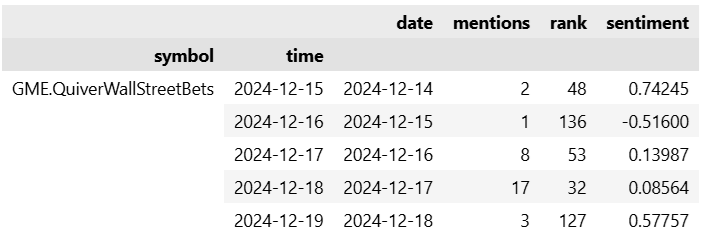
# Calculate the changes in sentiment.
sentiment_diff = history.sentiment.diff().iloc[1:]
symbol                    time
GME.QuiverWallStreetBets  2024-12-16   -1.25845
                          2024-12-17    0.65587
                          2024-12-18   -0.05423
                          2024-12-19    0.53118
Name: sentiment, dtype: float64
If you request a DataFrame, LEAN unpacks the data from Slice objects to populate the DataFrame.
If you intend to use the data in the DataFrame to create alternativeDataClass objects, request that the history request returns the data type you need.
Otherwise, LEAN will consume computational resources populating the DataFrame.
To get a list of dataset objects instead of a DataFrame, call the history[alternativeDataClass] method.
# Get the trailing 5 days of QuiverWallStreetBets data for an asset in QuiverWallStreetBets format.
history = self.history[QuiverWallStreetBets](dataset_symbol, 5, Resolution.DAILY)
# Iterate through each QuiverWallStreetBets object.
for data_point in history:
    t = data_point.end_time
    sentiment = data_point.sentiment
Some alternative datasets provide multiple entries per asset per time step.
For example, the True Beats dataset provides EPS and revenue predictions for several upcoming quarters per asset per day.
In this case, use a nested loop to access all the data point attributes.
In this case, to organize the data into a DataFrame, set the flatten argument to True.
public class USEquityTrueBeatsHistoryAlgorithm : QCAlgorithm
{
    public override void Initialize()
    {
        SetStartDate(2024, 1, 3);
        // Get the ExtractAlphaTrueBeats data for AAPL on 01/02/2024.
        var symbol = AddEquity("AAPL", Resolution.Daily).Symbol;
        var datasetSymbol = AddData<ExtractAlphaTrueBeats>(symbol).Symbol;
        var history = History<ExtractAlphaTrueBeats>(
            datasetSymbol, new DateTime(2024, 1, 2), new DateTime(2024, 1, 3), Resolution.Daily
        );
        // Iterate through each day of history.
        foreach (var trueBeats in history)
        {
            // Calculate the mean TrueBeat estimate for this day.
            var t = trueBeats.EndTime;
            var meanTrueBeat = trueBeats.Data
                .Select(estimate => estimate as ExtractAlphaTrueBeat)
                .Average(estimate => estimate.TrueBeat);
        }
    }
}
class USEquityTrueBeatsHistoryAlgorithm(QCAlgorithm):
def initialize(self) -> None:
self.set_start_date(2024, 1, 3)
# Get the ExtractAlphaTrueBeats data for AAPL on 01/02/2024 organized in a flat DataFrame.
aapl = self.add_equity("AAPL", Resolution.DAILY)
aapl.true_beats = self.add_data(ExtractAlphaTrueBeats, aapl.symbol).symbol
history = self.history(
aapl.true_beats, datetime(2024, 1, 2), datetime(2024, 1, 3), Resolution.DAILY, flatten=True
)

# Calculate the mean TrueBeat estimate for each day.
mean_true_beats_by_day = history.drop('time', axis=1).groupby('time').apply(lambda g: g.truebeat.mean())
time
2024-01-02 12:30:00   -0.007034
dtype: float64
For information on historical data for other alternative datasets, see the documentation in the Dataset Market.
Indicators
To get historical indicator values, call the IndicatorHistoryindicator_history method with an indicator and the asset's Symbol.
public class USEquityIndicatorHistoryAlgorithm : QCAlgorithm
{
    public override void Initialize()
    {
        SetStartDate(2024, 12, 19);
        // Get the Symbol of an asset.
        var symbol = AddEquity("SPY").Symbol;
        // Get the 21-day SMA values of an asset for the last 5 trading days.
        var history = IndicatorHistory(new SimpleMovingAverage(21), symbol, 5, Resolution.Daily);
        // Get the maximum of the SMA values.
        var maxSMA = history.Max(indicatorDataPoint => indicatorDataPoint.Current.Value);
    }
}
class USEquityIndicatorHistoryAlgorithm(QCAlgorithm):
def initialize(self) -> None:
self.set_start_date(2024, 12, 19)
# Get the Symbol of an asset.
symbol = self.add_equity('SPY').symbol
# Get the 21-day SMA values of an asset for the last 5 trading days.
history = self.indicator_history(SimpleMovingAverage(21), symbol, 5, Resolution.DAILY)
To organize the data into a DataFrame, use the data_frame property of the result.
# Organize the historical indicator data into a DataFrame to enable pandas wrangling.
history_df = history.data_frame
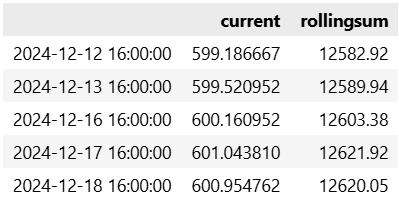
# Get the maximum of the SMA values.
sma_max = history_df.current.max()
The IndicatorHistoryindicator_history method resets your indicator, makes a history request, and updates the indicator with the historical data.
Just like with regular history requests, the IndicatorHistoryindicator_history method supports time periods based on a trailing number of bars, a trailing period of time, or a defined period of time.
If you don't provide a resolution argument, it defaults to match the resolution of the security subscription.
To make the IndicatorHistoryindicator_history method update the indicator with an alternative price field instead of the close (or mid-price) of each bar, pass a selector argument.
// Get the historical values of an indicator over the last 30 days, applying the indicator to the asset's volume.
var history = IndicatorHistory(indicator, symbol, TimeSpan.FromDays(30), selector: Field.Volume);
# Get the historical values of an indicator over the last 30 days, applying the indicator to the asset's volume.
history = self.indicator_history(indicator, symbol, timedelta(30), selector=Field.VOLUME)
Some indicators require the prices of two assets to compute their value (for example, Beta).
In this case, pass a list of the Symbol objects to the method.
public class USEquityMultiAssetIndicatorHistoryAlgorithm : QCAlgorithm
{
    public override void Initialize()
    {
        SetStartDate(2024, 12, 19);
        // Add the target and reference assets.
        var targetSymbol = AddEquity("AAPL").Symbol;
        var referenceSymbol = AddEquity("SPY").Symbol;
        // Create a 21-period Beta indicator.
        var beta = new Beta("", targetSymbol, referenceSymbol, 21);
        // Get the historical values of the indicator over the last 10 trading days.
        var history = IndicatorHistory(beta, new[] {targetSymbol, referenceSymbol}, 10, Resolution.Daily);
        // Get the average Beta value.
        var avgBeta = history.Average(indicatorDataPoint => indicatorDataPoint.Current.Value);
    }
}
class USEquityMultiAssetIndicatorHistoryAlgorithm(QCAlgorithm):
def initialize(self) -> None:
self.set_start_date(2024, 12, 19)
# Add the target and reference assets.
target_symbol = self.add_equity('AAPL').symbol
reference_symbol = self.add_equity('SPY').symbol
# Create a 21-period Beta indicator.
beta = Beta("", target_symbol, reference_symbol, 21)
# Get the historical values of the indicator over the last 10 trading days.
history = self.indicator_history(beta, [target_symbol, reference_symbol], 10, Resolution.DAILY)
# Get the average Beta value.
beta_avg = history.data_frame.mean()
If you already have a list of Slice objects, you can pass them to the IndicatorHistoryindicator_history method to avoid the internal history request.
var slices = History(new[] {symbol}, 30, Resolution.Daily);
var history = IndicatorHistory(indicator, slices);
Short Availability
To get historical values for the borrow fee rate, borrow rebate rate, or shortable quantity of a US Equity, call the FeeRatefee_rate, RebateRaterebate_rate, or ShortableQuantityshortable_quantity methods of its shortable provider.
public class USEquityShortAvailabilityHistoryAlgorithm : QCAlgorithm
{
    public override void Initialize()
    {
        SetStartDate(2024, 12, 19);
        // Add an asset and save a reference to the Equity object.
        var security = AddEquity("SPY");
        // Overwrite the default shortable provider to one that provides data.
        security.SetShortableProvider(new InteractiveBrokersShortableProvider());
        // Select a time in the past.
        var t = Time.AddDays(-30);
        // Pass the time argument to shortable provider to get historical values.
        var feeRate = security.ShortableProvider.FeeRate(security.Symbol, t);
        var rebateRate = security.ShortableProvider.RebateRate(security.Symbol, t);
        var shortableQuantity = security.ShortableProvider.ShortableQuantity(security.Symbol, t);
    }
}
class USEquityShortAvailabilityHistoryAlgorithm(QCAlgorithm):
def initialize(self) -> None:
self.set_start_date(2024, 12, 19)
# Add an asset and save a reference to its Equity object.
security = self.add_equity('SPY')
# Overwrite the default shortable provider to one that provides data.
security.set_shortable_provider(InteractiveBrokersShortableProvider())
# Select a time in the past.
t = self.time - timedelta(30)
# Pass the time argument to shortable provider to get historical values.
fee_rate = security.shortable_provider.fee_rate(security.symbol, t)
rebate_rate = security.shortable_provider.rebate_rate(security.symbol, t)
shortable_quantity = security.shortable_provider.shortable_quantity(security.symbol, t)
For more information about security initializers, see Set Security Initializer.
Examples
The following examples demonstrate some common practices for trading using historical requests.
Example 1: Mean-Variance Portfolio
The following algorithm constructs a monthly rebalance mean-variance portfolio using the top 20 liquid equities. The position sizing can be optimized by 1-year historical daily return of the universe members.
public class HistoricalRequestAlgorithm : QCAlgorithm
{
    private Universe _universe;
    private IPortfolioOptimizer _optimizer;

    public override void Initialize()
    {
        SetStartDate(2020, 4, 1);
        SetEndDate(2020, 9, 30);

        // Monthly renewal of the top 20 liquid universe to trade popular stocks.
        UniverseSettings.Schedule.On(DateRules.MonthStart());
        _universe = AddUniverse(Universe.DollarVolume.Top(20));

        // Instantiate the optimizer to perform mean-variance optimization.
        // Mean-variance optimization will not consider a risk-free rate, so we use 0.
        _optimizer = new MaximumSharpeRatioPortfolioOptimizer(0, 1, 0);

        // Set a scheduled event to rebalance the portfolio at the start of every month.
        Schedule.On(
            DateRules.MonthStart(),
            TimeRules.At(9, 31),
            Rebalance
        );
    }

    private void Rebalance()
    {
        // Historical data request to get 1-year data for optimization.
        var symbols = _universe.Selected.ToList();
        var history = History<TradeBar>(symbols, 253, Resolution.Daily)
            .Where(x => symbols.All(y => x.ContainsKey(y)) && x.All(y => y.Value.Close > 0m))
            .ToList();
        // Daily return on the universe members to calculate the optimized weights.
        var returns = GetReturns(history, symbols);

        // Calculate the optimized weights.
        var weights = _optimizer.Optimize(returns);

        // Rebalance the portfolio according to the optimized weights.
        var targets = Enumerable.Range(0, weights.Length)
            .Select(i => new PortfolioTarget(symbols[i], Convert.ToDecimal(weights[i])))
            .ToList();
        SetHoldings(targets, liquidateExistingHoldings: true);
    }

    private double[,] GetReturns(List<DataDictionary<TradeBar>> history, List<Symbol> symbols)
    {
        // Create a 2d array of historical daily returns from historical price data.
        var returns = new double[history.Count, symbols.Count];
        for (int j = 0; j < symbols.Count; j++)
        {
            var lastPrice = 0m;
            for (int i = 0; i < history.Count; i++)
            {
                var current = history[i][symbols[j]].Close;
                if (i > 0)
                {
                    returns[i, j] = (double)((current - lastPrice) / lastPrice);
                }
                lastPrice = current;
            }
        }
        return returns;
    }
}
from Portfolio.MaximumSharpeRatioPortfolioOptimizer import MaximumSharpeRatioPortfolioOptimizer
class HistoricalRequestAlgorithm(QCAlgorithm):
def initialize(self) -> None:
self.set_start_date(2020, 4, 1)
self.set_end_date(2020, 9, 30)
# Monthly renewal of the top 20 liquid universe to trade popular stocks.
self.universe_settings.schedule.on(self.date_rules.month_start())
self._universe = self.add_universe(self.universe.dollar_volume.top(20))
# Instantiate the optimizer to perform mean-variance optimization.
# Mean-variance optimization will not consider a risk-free rate, so we use 0.
self._optimizer = MaximumSharpeRatioPortfolioOptimizer(0.0, 1.0, 0.0)
# Set a scheduled event to rebalance the portfolio at the start of every month.
self.schedule.on(
self.date_rules.month_start(),
self.time_rules.at(9, 31),
self.rebalance
)
def rebalance(self) -> None:
# Historical data request to get 1-year data for optimization.
symbols = self._universe.selected
history = self.history(symbols, 253, Resolution.DAILY).close.unstack(0).dropna()
# Daily return on the universe members to calculate the optimized weights.
returns = history.pct_change().dropna()
# Calculate the optimized weights.
weights = self._optimizer.optimize(returns)
# Rebalance the portfolio according to the optimized weights.
targets = [PortfolioTarget(symbol, size) for symbol, size in zip(symbols, weights)]
self.set_holdings(targets, liquidate_existing_holdings=True)
Other Examples
For more examples, see the following algorithms: