Historical Data
Alternative Data
Introduction
Alternative datasets provide signals to inform trading decisions. To view all the alternative datasets available on QuantConnect, see the Dataset Market. This page explains how to get historical data for alternative datasets.
Data Points
To get a list of historical alternative data, call the History<alternativeDataClass> method with the dataset Symbol.
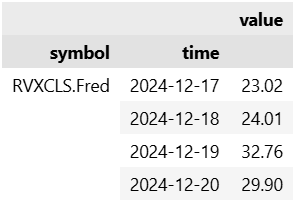
To get historical alternative data points, call the history method with the dataset Symbol.
This method returns a DataFrame that contains the data point attributes.
public class AlternativeDataHistoryAlgorithm : QCAlgorithm
{
    public override void Initialize()
    {
        SetStartDate(2024, 12, 20);
        // Get the Symbol of a dataset.
        var datasetSymbol = AddData<Fred>("RVXCLS").Symbol;
        // Get the trailing 5 days of Fred data.
        var history = History<Fred>(datasetSymbol, 5, Resolution.Daily);
        // Iterate through the historical data points.
        foreach (var dataPoint in history)
        {
            var t = dataPoint.EndTime;
            var value = dataPoint.Value;
        }
    }
}
class AlternativeDataHistoryAlgorithm(QCAlgorithm):
def initialize(self) -> None:
self.set_start_date(2024, 12, 20)
# Get the Symbol of a dataset.
dataset_symbol = self.add_data(Fred, 'RVXCLS').symbol
# Get the trailing 5 days of Fred data in DataFrame format.
history = self.history(dataset_symbol, 5, Resolution.DAILY)
# Calculate the dataset's rate of change.
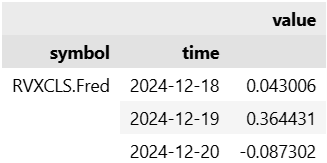
roc = history.pct_change().iloc[1:]
If you request a DataFrame, LEAN unpacks the data from Slice objects to populate the DataFrame.
If you intend to use the data in the DataFrame to create alternativeDataClass objects, request that the history request returns the data type you need.
Otherwise, LEAN will consume computational resources populating the DataFrame.
To get a list of dataset objects instead of a DataFrame, call the history[alternativeDataClass] method.
# Get the trailing 5 days of Fred data for an asset in Fred format.
history = self.history[Fred](dataset_symbol, 5, Resolution.DAILY)
# Iterate through the historical data points.
for data_point in history:
    t = data_point.end_time
    value = data_point.value
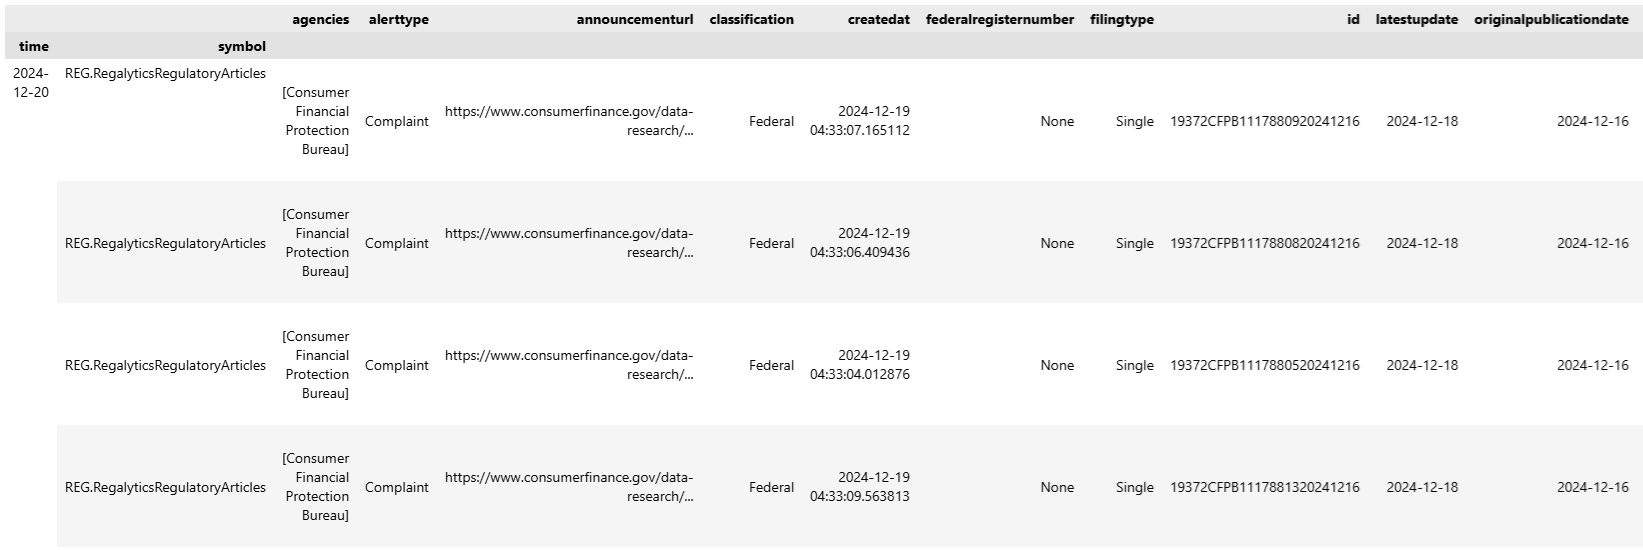
Some alternative datasets provide multiple entries per asset per time step.
For example, the US Regulatory Alerts dataset can provide multiple alerts per day.
In this case, use a nested loop to access all the data point attributes.
In this case, to organize the data into a DataFrame, set the flatten argument to True.
class RegalyticsHistoryAlgorithm(QCAlgorithm):

    def initialize(self) -> None:
        self.set_start_date(2024, 12, 20)
        # Get the all the Regalytics articles that were published over the last day, organized in a DataFrame.
        dataset_symbol = self.add_data(RegalyticsRegulatoryArticles, "REG").symbol
        history = self.history(dataset_symbol, 1, Resolution.DAILY, flatten=True)
public class RegalyticsHistoryAlgorithm : QCAlgorithm
{
public override void Initialize()
{
SetStartDate(2024, 12, 20);
// Get the all the Regalytics articles that were published over the last day.
var datasetSymbol = AddData<RegalyticsRegulatoryArticles>("REG").Symbol;
var history = History<RegalyticsRegulatoryArticles>(datasetSymbol, 1, Resolution.Daily);
// Iterate through each day of articles.
foreach (var articles in history)
{
var t = articles.EndTime;
// Get the unique alert types for this day.
var altertTypes = articles.Select(article => (article as RegalyticsRegulatoryArticle).AlertType).Distinct().ToList();
}
}
}
# Get all the unique alert types from the Regalytics articles.
alert_types = history.alerttype.unique()
array(['Complaint', 'Press release', 'Event', 'Litigation Release',
       'Grant Information', 'Media Release', 'News', 'Announcement',
       'Transcript', 'Decree', 'Decision', 'Regulation',
       'Executive Order', 'Media Advisory', 'Disaster Press Release',
       'Notice', 'Procurement', 'Meeting', 'News release', 'Contract',
       'Publication', 'Blog', 'Tabled Document', 'Resolution', 'Bill',
       'Concurrent Resolution', 'Opinions and Adjudicatory Orders',
       'Proposed rule', 'Technical Notice', 'Sanction', 'Order',
       'Statement', 'Rule', 'enforcement action', 'Report',
       'Statement|Release',
       'AWCs (Letters of Acceptance, Waiver, and Consent)'], dtype=object)
Universes
To get historical data for an alternative data universe, call the History method with the Universe object.
To get historical data for an alternative data universe, call the history method with the Universe object.
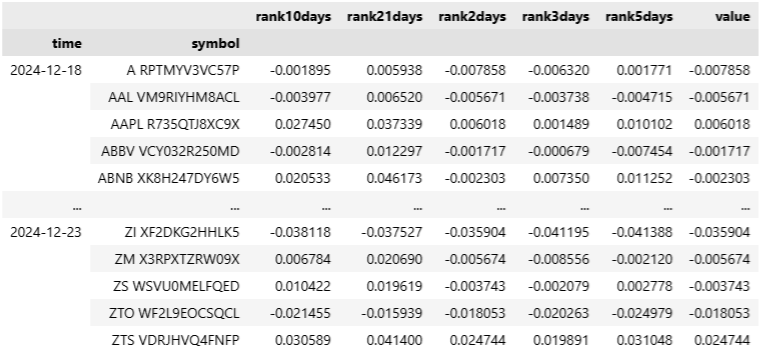
Set the flatten argument to True to get a DataFrame that has columns for the data point attributes.
public class AltDataUniverseHistoryAlgorithm : QCAlgorithm
{
    public override void Initialize()
    {
        SetStartDate(2024, 12, 23);
        // Add a universe of US Equities based on an alternative dataset.
        var universe = AddUniverse<BrainStockRankingUniverse>();
        // Get 5 days of history for the universe.
        var history = History(universe, TimeSpan.FromDays(5));
        // Iterate through each day of the universe history.
        foreach (var altCoarse in history)
        {
            // Iterate through each asset in the universe on this day and access its data point attributes.
            foreach (BrainStockRankingUniverse stockRanking in altCoarse)
            {
                var symbol = stockRanking.Symbol;
                var t = stockRanking.EndTime;
                var rank2Days = stockRanking.Rank2Days;
            }
        }
    }
}
class AltDataUniverseHistoryAlgorithm(QCAlgorithm):
def initialize(self) -> None:
self.set_start_date(2024, 12, 23)
# Add a universe of US Equities based on an alternative dataset.
universe = self.add_universe(BrainStockRankingUniverse)
# Get 5 days of history for the universe.
history = self.history(universe, timedelta(5), flatten=True)
# Select the asset with the greatest value each day.
daily_winner = history.groupby('time').apply(lambda x: x.nlargest(1, 'value')).reset_index(level=1, drop=True).value
time        symbol
2024-12-18  FIC R735QTJ8XC9X    0.054204
2024-12-19  FIC R735QTJ8XC9X    0.073250
2024-12-20  FIC R735QTJ8XC9X    0.065142
2024-12-21  FIC R735QTJ8XC9X    0.065142
2024-12-22  FIC R735QTJ8XC9X    0.065142
2024-12-23  FIC R735QTJ8XC9X    0.065142
Name: value, dtype: float64
To get the data in the format of the objects that you receive in your universe filter function instead of a DataFrame, use flatten=False.
# Get the historical universe data over the last 5 days in a Series where
# the values in the series are lists of the universe selection objects.
history = self.history(universe, timedelta(5), flatten=False)
# Select the asset with the greatest value each day.
for (universe_symbol, time), data in history.items():
    leader = sorted(data, key=lambda x: x.value)[-1]
Slices
To request Slice objects of historical data, call the History method.
If you pass a list of Symbol objects, it returns data for all the alternative datasets that the Symbol objects reference.
public class SliceHistoryAlgorithm : QCAlgorithm
{
    public override void Initialize()
    {
        SetStartDate(2024, 12, 23);
        // Add an alternative dataset.
        var symbol = AddCrypto("BTCUSD", Resolution.Daily, Market.Bitfinex).Symbol;
        var datasetSymbol = AddData<BitcoinMetadata>(symbol).Symbol;
        // Get the latest 3 data points of some alternative dataset(s), packaged into Slice objects.
        var history = History(new[] { datasetSymbol }, 3);
        // Iterate through each Slice and get the alternative data points.
        foreach (var slice in history)
        {
            var t = slice.Time;
            var hashRate = slice[datasetSymbol].HashRate;
        }
    }
}
If you don't pass any Symbol objects, it returns data for all the data subscriptions in your notebook, so the result may include more than just alternative data.
To request Slice objects of historical data, call the history method without providing any Symbol objects.
It returns data for all the data subscriptions in your notebook, so the result may include more than just alternative data.
// Get the latest 3 data points of all the securities/datasets in the notebook, packaged into Slice objects.
var history = History(3);
// Iterate through each Slice and get the synchronized data points at each moment in time.
foreach (var slice in history)
{
    var t = slice.Time;
    if (slice.ContainsKey(symbol))
    {
        var price = slice[symbol].Price;
    }
    if (slice.ContainsKey(datasetSymbol))
    {
        var hashRate = ((BitcoinMetadata)slice[datasetSymbol]).HashRate;
    }
}
class SliceHistoryAlgorithm(QCAlgorithm):
def initialize(self) -> None:
self.set_start_date(2024, 12, 23)
# Add an asset and an alternative dataset.
symbol = self.add_crypto('BTCUSD', Resolution.DAILY, Market.BITFINEX).symbol
dataset_symbol = self.add_data(BitcoinMetadata, symbol).symbol
# Get the latest 3 data points of all the securities/datasets in the notebook, packaged into Slice objects.
history = self.history(3)
# Iterate through each Slice and get the synchronized data points at each moment in time.
for slice_ in history:
t = slice_.time
if symbol in slice_:
price = slice_[symbol].price
if dataset_symbol in slice_:
hash_rate = slice_[dataset_symbol].hash_rate
When your history request returns Slice objects, the Timetime properties of these objects are based on the notebook time zone, but the EndTimeend_time properties of the individual data objects are based on the data time zone.
The EndTimeend_time is the end of the sampling period and when the data is actually available.
Sparse Datasets
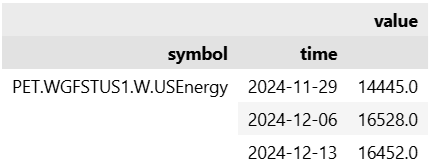
A sparse dataset is a dataset that doesn't have data for every time step of its resolution. For example, the US Energy Information Administration (EIA) datasets have a daily resolution but the data for the "U.S. Ending Stocks of Finished Motor Gasoline in Thousand Barrels (Mbbl)" series only updates once a week. So when you request the trailing 30 days of historical data for it, you only get a few data points.
class SparseDatasetHistoryAlgorithm(QCAlgorithm):

    def initialize(self) -> None:
        self.set_start_date(2024, 12, 23)
        # Add a sparse dataset. In this case, the default resolution is daily.
        symbol = self.add_data(USEnergy, 'PET.WGFSTUS1.W').symbol
        # Get 30 days of history for the dataset.
        history = self.history(symbol, 30)
public class SparseDatasetHistoryAlgorithm : QCAlgorithm
{
public override void Initialize()
{
SetStartDate(2024, 12, 23);
// Add a sparse dataset. In this case, the default resolution is daily.
var symbol = AddData<USEnergy>("PET.WGFSTUS1.W").Symbol;
// Get 30 days of history for the dataset.
var history = History(symbol, 30);
// Iterate through each data point.
foreach (var dataPoint in history)
{
var t = dataPoint.EndTime;
var weeklyImports = dataPoint.Value;
}
}
}
Most alternative datasets have only one resolution, which is usually daily. To check if a dataset is sparse and to view its resolution(s), see the documentation in the Dataset Market.