


Introduction
In this research, we examine a strategy that seeks to identify periods when providing insurance to market participants is profitable through writing put Option contracts. The strategy relies on estimates of future volatility and a novel Strike Availability factor, then utilizes clustering to signal when these factors are at elevated levels, indicating upcoming volatility. The results show that the strategy has a high win rate but modest cumulative returns.
Background
Absolute return measures your strategy’s rate of return over the backtest period. This strategy’s performance is intended to be measured by absolute return because its goal is to generate small consistent returns, not outperform the Equity market index.
Implied volatility (IV) estimates an underlying asset’s annualized volatility from the current moment to the Option contract’s expiration date. LEAN uses the Black-Scholes model to calculate the IV of Index (European style) Options. In the on_data method, the IV values in the Slice are taken from the Option pricing reality model.
IV Rank is a metric that describes how high or low the current IV of an underlying asset is relative to historical IV values. It’s a decimal number between 0 and 1, where 0 means the current IV is the lowest IV over some lookback window, and 1 means the current IV is the highest IV. That is, a high IV rank suggests the underlying asset will have relatively high volatility in the future. Since there is a volatility smile that occurs across the Option chain, to assign a single value to the underlying asset as its IV Rank, we need to aggregate the IV values of the individual contracts in some way. There are several aggregation techniques. The following Implementation section describes our approach in this research.
Strike Availability is a custom factor we’ve designed for this strategy. The following image shows that the number of strikes in the Option chain varies over time as the underlying price fluctuates and market participants demand wider strike prices. It appears it can act as a leading indicator, showing the number of strikes tends to increase before market corrections.

We can divide the number of strikes by the underlying Index price to remove the impact of price rises.

To prepare the factor for the clustering model, we can calculate the blue line’s rate of change.
K-means clustering is an unsupervised machine learning model. It identifies clusters in a dataset by randomly placing k centroids throughout it. It then assigns each data point to the nearest centroid and moves the centroid to the mean location of all its assigned data points. When the centroids stop moving, the model is fit, and the clusters are identified. The following image demonstrates the fitting process for one-dimensional data.

In this strategy, we use k-means clustering to label the current IV Rank and Strike Availability factor values as low (0), medium (1), or high (2). We expect future downside volatility to be high when both factors are high. In this case, we exit the market. Otherwise, we expect future volatility to be low or moderate, which is a relatively safe time to write put Options (i.e. provide market insurance).
Implementation
To implement this strategy, we start by adding the SPX Index and creating a standard deviation indicator for it in the initialize method. We’ll need the standard deviation when we select a strike price.
self._index = self.add_index('SPX')self._index.std = self.std(self._index.symbol, 22, Resolution.DAILY)
Next, we add the Index Options universe, add the factors, and define a member to track the current contract in the portfolio. To calculate the IV Rank, we’ll take the median IV of at-the-money contracts with the closest expiry between 30 and 90 days.
self._option.set_filter(lambda universe: universe.include_weeklys().expiration(30, 90).strikes(-1, 1))self._option.iv_rank = IVRank()self._option.strike_availability = StrikeAvailability()self._option.contract = None
To end the initialize method, we add a warm-up period that primes the factors and add a Scheduled Event that updates the factors and the portfolio holdings.
self.schedule.on(self.date_rules.every_day(self._index.symbol), self.time_rules.after_market_open(self._index.symbol, 1), self._rebalance)self.set_warm_up(timedelta(365))
We first update the factors in the _rebalance method that runs each day. The Strike Availability factor needs the entire Option chain, so we pass it the result of the option_chain method. The IV Rank factor needs just the ATM contracts, so we pass it to the intraday Option chain in the Slice. To view the implementation of these update methods, see the attached backtest.
chain = self.option_chain(self._index.symbol, flatten=True).data_frameif chain.empty:returnif self._option.strike_availability.update(self.time, chain)universe_chain = self.current_slice.option_chains.get(self._option.symbol)if not universe_chain or not self._option.iv_rank.update(universe_chain) or self.is_warming_up:return
Next, if we hold a contract, we check if we should liquidate it. We liquidate contracts if the IV Rank and Strike Availability are high, the contract expires within one week, or the contract is no longer out of the money.
if self.portfolio.invested:if self._option.iv_rank.label == 2 and self._option.strike_availability.label == 2:self.liquidate(tag='IV rank and strike availability is high!')elif self._option.contract.id.date - self.time < timedelta(7):self.liquidate(tag='Expires within 7 days')elif self._index.price <= self._option.contract.id.strike_price:self.liquidate(tag='ATM')
Lastly, we look for an entry if we aren’t currently invested. We enter the market if both the IV Rank and Strike Availability are not high, which means we expect low or moderate volatility in the future. The Put contract we sell should have the closest expiry after 30 days and have a strike that is >3 standard deviations below the current price. Assuming the returns are normally distributed, a strike price that is 3 standard deviations below the Index price should only be hit ~1% of the time. In our experiments, we found the contracts expired OTM about 93% of the time.
elif self._option.iv_rank.label < 2 and self._option.strike_availability.label < 2:chain = chain[(chain.expiry == chain.expiry[chain.expiry - self.time >= timedelta(30)].min()) & (chain.right == OptionRight.PUT) & (chain.strike <= self._index.price)].sort_values('strike')self._option.contract = chain.index[-min(int(3*self._index.std.current.value/5), len(chain))]self.add_option_contract(self._option.contract)self.set_holdings(self._option.contract, -0.25)
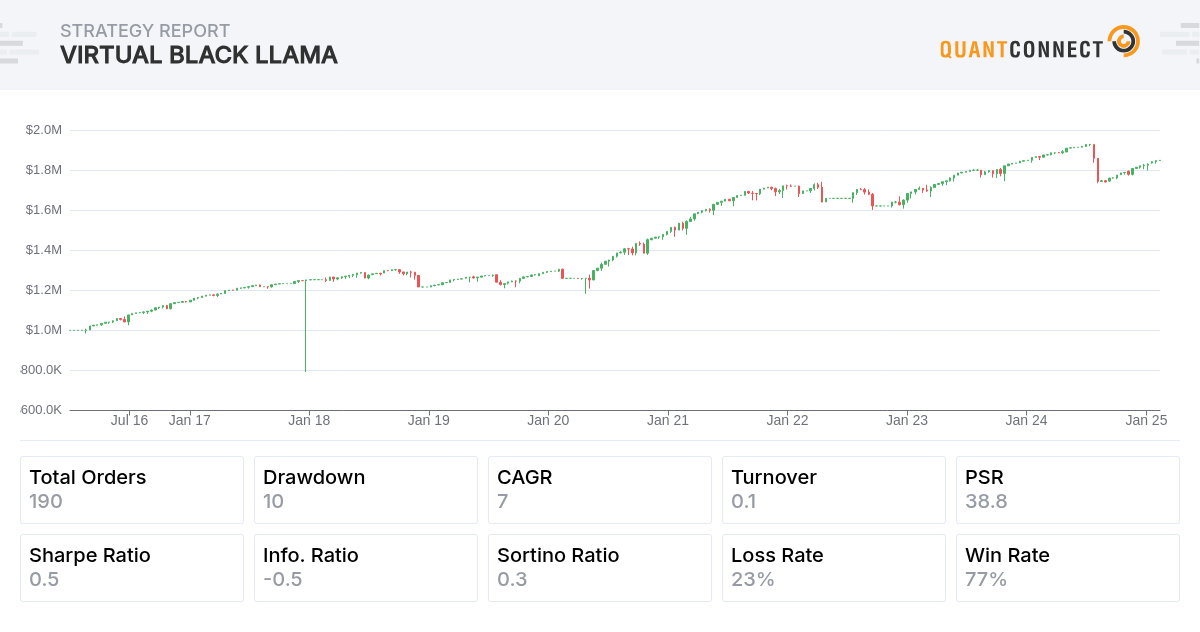
Results
We backtested the algorithm from January 2016 to the present. The strategy achieved a CAGR of 6.961%. As it intends to be an absolute return strategy, the results are presented without a benchmark.
To test the sensitivity of the parameters chosen, we ran a parameter optimization job. We tested the exit condition of liquidating the contract from 1 week until expiry to 3 weeks until expiry in steps of 0.5 weeks and we tested selecting different strike prices between 1 standard deviation below the underlying price and 3 standard deviations below in steps of 0.5. Of the 25 parameter combinations, 25 (100 %) were profitable. The following image shows the heatmap of CAGR for the parameter combinations:

The following image shows the heatmap of win rates for the parameter combinations:

The win rate heatmap shows that the strategy has a higher win rate when we sell contracts that are further OTM. The red circle in the preceding image identifies the parameters we chose as the strategy's default.
The equity curve is characteristic of the insurance provider business, which benefits from consistent premiums but can experience relatively large occasional losses. Further research areas include diversifying the strategy across many uncorrelated markets to increase risk-adjusted returns.


Douglas Goullet
Thank you for the research, it always an eye opener of what you can do with QC!
The material on this website is provided for informational purposes only and does not constitute an offer to sell, a solicitation to buy, or a recommendation or endorsement for any security or strategy, nor does it constitute an offer to provide investment advisory services by QuantConnect. In addition, the material offers no opinion with respect to the suitability of any security or specific investment. QuantConnect makes no guarantees as to the accuracy or completeness of the views expressed in the website. The views are subject to change, and may have become unreliable for various reasons, including changes in market conditions or economic circumstances. All investments involve risk, including loss of principal. You should consult with an investment professional before making any investment decisions.
Yarden Yaroshevski
Super interesting - thank you
The material on this website is provided for informational purposes only and does not constitute an offer to sell, a solicitation to buy, or a recommendation or endorsement for any security or strategy, nor does it constitute an offer to provide investment advisory services by QuantConnect. In addition, the material offers no opinion with respect to the suitability of any security or specific investment. QuantConnect makes no guarantees as to the accuracy or completeness of the views expressed in the website. The views are subject to change, and may have become unreliable for various reasons, including changes in market conditions or economic circumstances. All investments involve risk, including loss of principal. You should consult with an investment professional before making any investment decisions.
To unlock posting to the community forums please complete at least 30% of Boot Camp.
You can continue your Boot Camp training progress from the terminal. We hope to see you in the community soon!