


Introduction
In this research post, we investigate trading opportunities around the topic of US presidential elections. The result of such a significant event can cause a regime change in the financial markets. Finding a robust strategy that has a proven track record of outperformance under both political parties can be a great addition to a portfolio of strategies. Although our research didn't uncover any probable alpha, we wanted to share our research process, code, and why we discarded the strategies.
Allocating to Partisan Sectors Post-Election
We explored there being a "honeymoon period" after each election, where party-friendly sectors outperform the overall market. In this case, we might be able to outperform the market by concentrating the portfolio in these sectors and giving greater weight to smaller companies.
We tested this by implementing a strategy that rebalances the portfolio on a monthly basis. Most of the time, it just holds the benchmark, SPY. For the 18 months following each election, it forms an inverse-market-cap weighted portfolio instead. If Democrats have control, it uses the SPY constituents within the Healthcare or Technology sectors. If Republicans have control, it uses the SPY constituents within the Energy or Financial Services sectors. We got these sector suggestions from Grok, the LLM on the X platform.

The backtest achieved a 0.798 Sharpe ratio. In contrast, the SPY achieved a 0.646 Sharpe ratio during the same time period. However, we rejected this strategy because using the sectors selected by Grok likely caused look-ahead bias to seep into the test. Furthermore, we expected the algorithm to underperform the SPY when we flipped the party/sector mappings, but it still outperformed the SPY.
Validating Partisan Sectors with ETF Returns
Instead of asking Grok for the sectors to use under each political party, we believed we could find the party-friendly sectors by analyzing the return of sector ETFs for the 18 month period after each election. We tested this by implementing a research notebook that calculates the return of the ETFs over each time period. The output showed there is no consistent link between the winning political party and the rank of future sector returns.

Assigning Industry Political Alignment by Returns Correlation to Ruling Party
Since we couldn't find a consistent link between the sector performance and the ruling political party, we explored the idea that industries are tied to a political party. Maybe they outperform when their party is in control and underperform otherwise. To assign each industry to a party, we can use the correlation between the industry outperforming and each political party being in office.
We tested this by implementing a strategy that creates a time series of 0/1 values for each industry, where 1 represents the industry achieved a greater monthly return than the median return for the month across all the industries. It also creates another series of 0/1 values, where 1 represents the Republican party is in the White House for the month. At the start of each month, it then calculates the correlation between these two series for each industry, then forms a correlation-weighted portfolio for each industry, using the largest asset in each industry as the asset to trade.

The backtest achieved a 0.73 Sharpe ratio over the last 5 years. In contrast, the SPY achieved a 0.582 Sharpe ratio over the same time period. However, we rejected this strategy because it fails to outperform over a 12-year backtest, a period where both parties have a turn in office over time.
Testing Theory with Narrow Focus on Hyper Partisan Industry
Based on the results of the previous strategy, we wanted to verify our methodology of calculating the correlation produced reasonable results. We believed that industries closely aligned with the Republican party should have a positive correlation coefficient when we calculate the correlation using the two time series of 0/1 values described above.
We tested this by implementing a research notebook. It gets all the historical prices for Sturm Ruger & Company Inc, the second largest gun manufacturer. It creates the time series of 0/1 values, where 1 represents the Republican party is in the White House. Next, it gets the Federal Funds Effective Rate from the US Federal Reserve (FRED) dataset and uses linear regression to remove the asset's exposure to changes in the Federal Funds Effective Rate. Lastly, it calculates the correlation between the sign of adjusted returns for Sturm Ruger & Company Inc and the time series of 0/1 values for the Republican party.

The results showed that the correlation coefficient is positive (0.0518), suggesting our methodology is functional but not strong enough to confidently state causation.
Assigning Party Alignment with K-Means Clustering
Inverting our thinking, we tried to apply the market behavior before the election to forecast the results. In other words, if right-leaning industries outperform left-leaning industries heading into an election, the Republican party will win the election and vice-versa.
We tested this by implementing a strategy. At the start of each month, it finds the largest asset of each industry and gets the trailing daily returns of those industry leaders over the last month. It stitches the trailing returns together each month to build a series of daily returns for each industry. At the start of November each election year, it collects some fundamental factor values on all the industry leaders, using specific factors that can help identify a company's political leaning. Using k-means clustering, it separates the industries into 3 distinct clusters and finds the cluster that has the greatest equal-weighted return over the last month. If this cluster has a greater return when the Democrats or Republicans are in office, it predicts that party wins the upcoming election.

The results showed that the algorithm predicted the Democrats to win each election year between 2012-2020 (2/3 correct), but we reject this approach since there are only 3 predictions given the data available.
Visualizing Post-Election Returns
We considered that industries could be tied to a political party and the sign of their return immediately after the election is dependent on their party winning.
We tested this by implementing a research notebook. It gets the largest asset of each industry for each election date. It calculates the equity curve of holding each asset for 7 or 30 days after each election, then displays all the equity curves in a giant matplotlib figure. Each row in the figure represents one industry. Each column represents one election. The color of each time series represents the winning political party. For example, the following image shows the plots for 4 of the elections for the agricultural inputs industry:
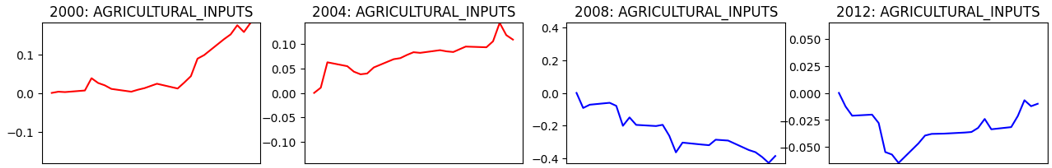
The results showed that there was no consistent pattern for all industries based solely on the election result, so we rejected this approach.
Shorting Volatility with Straddles Post-Election
Finally, we assumed markets experience a reduction in volatility after each election as the outcome of the election has been announced and uncertainty removed. To test this, we implemented a strategy that opens a short straddle on SPY on election day using contracts that have at least 30 days to expiry. The results showed the strategy is unprofitable and trades very infrequently.

Conclusion
In this post, we provided a behind-the-scenes look at our strategy research and development process. We investigated trading opportunities around the topic of US presidential elections. Although we didn’t find a long-running strategy that consistently outperforms the benchmark, there are always more experiments to run. We invite the community to continue searching for alpha around the US presidential election. One source of ideas is the research from Man Institute. If you find something interesting, please share it below.


Derek Melchin
The material on this website is provided for informational purposes only and does not constitute an offer to sell, a solicitation to buy, or a recommendation or endorsement for any security or strategy, nor does it constitute an offer to provide investment advisory services by QuantConnect. In addition, the material offers no opinion with respect to the suitability of any security or specific investment. QuantConnect makes no guarantees as to the accuracy or completeness of the views expressed in the website. The views are subject to change, and may have become unreliable for various reasons, including changes in market conditions or economic circumstances. All investments involve risk, including loss of principal. You should consult with an investment professional before making any investment decisions.
To unlock posting to the community forums please complete at least 30% of Boot Camp.
You can continue your Boot Camp training progress from the terminal. We hope to see you in the community soon!