


The CSI 300 is a capitalization-weighted stock market index that tracks the top 300 stocks listed on the two main stock exchanges in mainland China. In April 2020, South China Morning Post reported that “the 120-day correlation between the CSI 300 Index and the S&P 500 index recently rose to its highest level since Bloomberg began compiling the data in 2002.” The rise in correlation can be seen from the plot below.
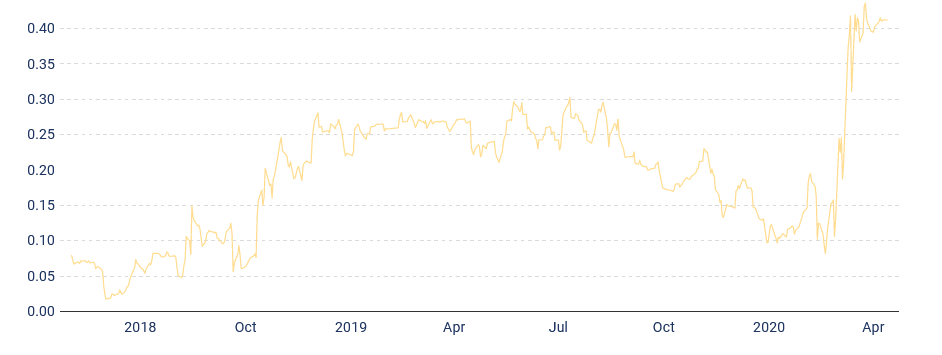
We attribute the increase in correlation to be a result of the coronavirus disrupting global supply chains. With such a significant spike in correlation, the benefits of diversification diminish as securities move closer in tandem with each other. To remain diversified amidst global market correlations, this episode of Idea Streams is focused on composing a portfolio of uncorrelated assets.
The Process
We start by attempting to reproduce the correlation plot above. We include SPY as the ETF to track the S&P 500 index. Since there is no CSI 300 ETF listed in the US, we select the next best option available to us to track China’s large-cap market, which is FXI. To extend our study to include other countries that were greatly affected by the coronavirus, we include an ETF that tracks the Italian market (EWI) and European market (VGK). Lastly, we also include GLD and SHY to track the correlation of SPY with gold and US bonds, respectively.
With all of our securities selected, we compute a rolling 120-day correlation between SPY and the other securities. From the plot that’s produced, we can see the characteristic spike in the correlation between FXI and SPY during March 2020.
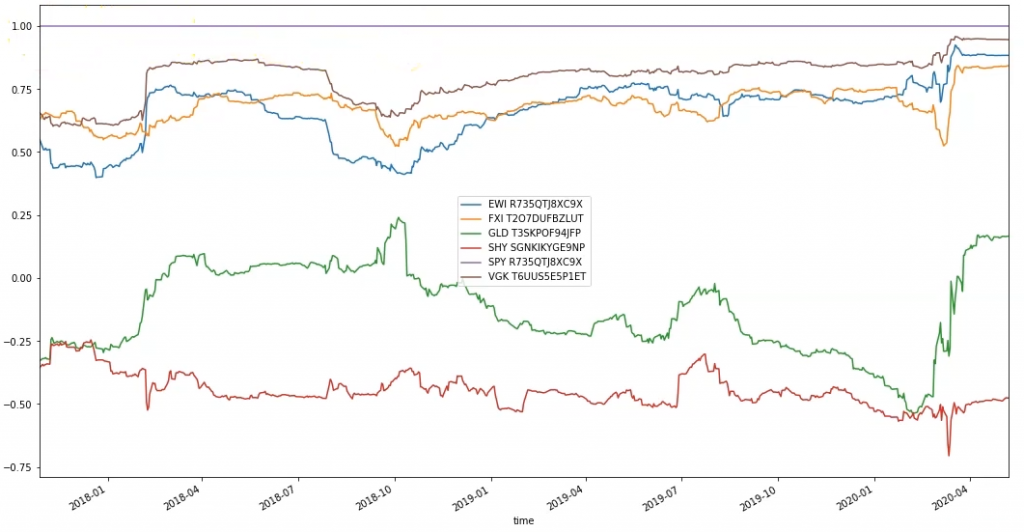
To maintain a portfolio of uncorrelated assets, we define our trading algorithm to rebalance the portfolio every trading day 5 minutes after the open. During each rebalance, we instruct the portfolio construction model to allocate half of the portfolio to SPY and half to the asset that has the lowest correlation with SPY over the last 120 days.
Results
Backtesting the strategy from January 1, 2019 resulted in a 0.813 Sharpe ratio and a 17.9% drawdown. In addition to these metrics, the strategy was also able to momentarily generate about a 98% Probabilistic Sharpe Ratio up until the 2020 crash. Since the SPY benchmark experienced a 35% drawdown during the same time period as our backtest, we conclude that our strategy outperformed the overall market benchmark.
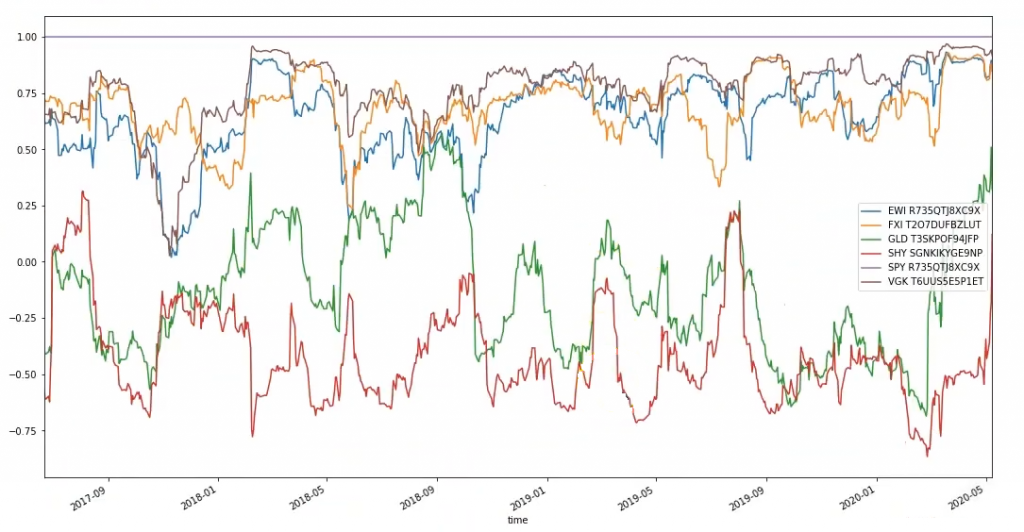
For those interested in continuing the development of this strategy, we recommend searching for ways to dynamically adjust the length of the lookback window used to compute the correlations. Instead of using a fixed 120-day window, defining a formula for the parameter value will allow the parameter to adapt as the market environment changes. One way to do this would be to look at the volatility of the market and use that to shorten the correlation period so that we are selecting assets that are uncorrelated over a shorter period of time. For instance, with a 30-day window, we can see the correlation signals contain much more noise, so the algorithm would change positions more frequently.
To get a copy of the strategy code, clone the backtest below.


Douglas Goullet
thanks for sharing. Isn´t 0.08% of average win to small of a profit after slippage and commission? thanks
The material on this website is provided for informational purposes only and does not constitute an offer to sell, a solicitation to buy, or a recommendation or endorsement for any security or strategy, nor does it constitute an offer to provide investment advisory services by QuantConnect. In addition, the material offers no opinion with respect to the suitability of any security or specific investment. QuantConnect makes no guarantees as to the accuracy or completeness of the views expressed in the website. The views are subject to change, and may have become unreliable for various reasons, including changes in market conditions or economic circumstances. All investments involve risk, including loss of principal. You should consult with an investment professional before making any investment decisions.
Spacetime
AlMoJo ,
Also, if you would like to explore more CBOE data sets, then you can use the Nasdaq Data Link provided below.
Correction in my last post: meant to say CBOE and not Quandl (Quandl was acquired by Nasdaq)
The material on this website is provided for informational purposes only and does not constitute an offer to sell, a solicitation to buy, or a recommendation or endorsement for any security or strategy, nor does it constitute an offer to provide investment advisory services by QuantConnect. In addition, the material offers no opinion with respect to the suitability of any security or specific investment. QuantConnect makes no guarantees as to the accuracy or completeness of the views expressed in the website. The views are subject to change, and may have become unreliable for various reasons, including changes in market conditions or economic circumstances. All investments involve risk, including loss of principal. You should consult with an investment professional before making any investment decisions.
Spacetime
AlMoJo , Just posting our QC CBOE Datasets link below for your reference if you need it.
The material on this website is provided for informational purposes only and does not constitute an offer to sell, a solicitation to buy, or a recommendation or endorsement for any security or strategy, nor does it constitute an offer to provide investment advisory services by QuantConnect. In addition, the material offers no opinion with respect to the suitability of any security or specific investment. QuantConnect makes no guarantees as to the accuracy or completeness of the views expressed in the website. The views are subject to change, and may have become unreliable for various reasons, including changes in market conditions or economic circumstances. All investments involve risk, including loss of principal. You should consult with an investment professional before making any investment decisions.
Vladimir
Spacetime,
There are only 6 trades for SHV in your version of the code.
Can you try changing in the code the VIX and VXV data retrieval in a way like in the attached sample.
The material on this website is provided for informational purposes only and does not constitute an offer to sell, a solicitation to buy, or a recommendation or endorsement for any security or strategy, nor does it constitute an offer to provide investment advisory services by QuantConnect. In addition, the material offers no opinion with respect to the suitability of any security or specific investment. QuantConnect makes no guarantees as to the accuracy or completeness of the views expressed in the website. The views are subject to change, and may have become unreliable for various reasons, including changes in market conditions or economic circumstances. All investments involve risk, including loss of principal. You should consult with an investment professional before making any investment decisions.
Spacetime
Hi Vladimir,
Hmm… not entirely sure why there were only 6 trades executed.
The above backtest which I have attached was taking a “bit” to complete for me and I was engaged with other work, so I ran the above model (shaerd by pangyuteng) with a start date of self.SetStartDate(2020, 11, 1) just to speed up things.
Hmm… I have extended the date range to start from self.SetStartDate(2019, 1, 1) and it does not have too many trades either. (backtest attached)
If you have noticed from the above example shared by pangyuteng , then it does not trade that often either. [ self.SetStartDate(2019, 1, 1) ]
But, the fixes which I have shared above does work as the error which was being received by AlMoJo is no longer occurring.
Hmm… maybe someone else might have a better idea on this, but I will try to look into this further. Hmm… maybe the LSTM configuration needs to be looked into or the volatility data resolution and other resolutions needs to be changed to minute time slice if possible.
The material on this website is provided for informational purposes only and does not constitute an offer to sell, a solicitation to buy, or a recommendation or endorsement for any security or strategy, nor does it constitute an offer to provide investment advisory services by QuantConnect. In addition, the material offers no opinion with respect to the suitability of any security or specific investment. QuantConnect makes no guarantees as to the accuracy or completeness of the views expressed in the website. The views are subject to change, and may have become unreliable for various reasons, including changes in market conditions or economic circumstances. All investments involve risk, including loss of principal. You should consult with an investment professional before making any investment decisions.
Vladimir
Spacetime,
I backtested cloned pangyuteng algorithm with only changes in my_custom_data
url_vix = "http://cache.quantconnect.com/alternative/cboe/vix.csv"
url_vxv = "http://cache.quantconnect.com/alternative/cboe/vix3m.csv"
It generated 13 SPY-SHY trades and metrics as your last one, but the performance is not comparable to pangyuteng's results.
The material on this website is provided for informational purposes only and does not constitute an offer to sell, a solicitation to buy, or a recommendation or endorsement for any security or strategy, nor does it constitute an offer to provide investment advisory services by QuantConnect. In addition, the material offers no opinion with respect to the suitability of any security or specific investment. QuantConnect makes no guarantees as to the accuracy or completeness of the views expressed in the website. The views are subject to change, and may have become unreliable for various reasons, including changes in market conditions or economic circumstances. All investments involve risk, including loss of principal. You should consult with an investment professional before making any investment decisions.
Spacetime
Vladimir,
Hmm… If you want to compare it with pangyuteng's results, then you have to provide an end date of self.SetEndDate(2020, 1, 1) because pangyuteng's model ends around that time. Please note, pangyuteng's post is time stamped somewhere in December 2019.
Try to run it with end date parameter and check to see if performance is comparable.
I have attached a backtest run starting from self.SetStartDate(2019, 1, 1) and ending at self.SetEndDate(2020, 1, 1) and it only traded once.
Hmm…
The material on this website is provided for informational purposes only and does not constitute an offer to sell, a solicitation to buy, or a recommendation or endorsement for any security or strategy, nor does it constitute an offer to provide investment advisory services by QuantConnect. In addition, the material offers no opinion with respect to the suitability of any security or specific investment. QuantConnect makes no guarantees as to the accuracy or completeness of the views expressed in the website. The views are subject to change, and may have become unreliable for various reasons, including changes in market conditions or economic circumstances. All investments involve risk, including loss of principal. You should consult with an investment professional before making any investment decisions.
Vladimir
Spacetime,
I definitely like the metrics from your last backtest, but my attempts to reproduce them for some reason were unsuccessful.
The material on this website is provided for informational purposes only and does not constitute an offer to sell, a solicitation to buy, or a recommendation or endorsement for any security or strategy, nor does it constitute an offer to provide investment advisory services by QuantConnect. In addition, the material offers no opinion with respect to the suitability of any security or specific investment. QuantConnect makes no guarantees as to the accuracy or completeness of the views expressed in the website. The views are subject to change, and may have become unreliable for various reasons, including changes in market conditions or economic circumstances. All investments involve risk, including loss of principal. You should consult with an investment professional before making any investment decisions.
AlMoJo
Hello everybody,
Pangyuteng this is an amazing result. Jack Simonson I also think technical indicators would help a lot.
I tested Pangyuteng version on the 2022 crash and it is not so good at dodging it. I taught maybe going hourly timeframe instead of daily could help even if I know that trading more frequently is not really good.
Anyone has an idea on how to change the timeframe? I tried to pass all the .Daily to .Hourly but obviously it wasn't that simple.
Kind Regards
The material on this website is provided for informational purposes only and does not constitute an offer to sell, a solicitation to buy, or a recommendation or endorsement for any security or strategy, nor does it constitute an offer to provide investment advisory services by QuantConnect. In addition, the material offers no opinion with respect to the suitability of any security or specific investment. QuantConnect makes no guarantees as to the accuracy or completeness of the views expressed in the website. The views are subject to change, and may have become unreliable for various reasons, including changes in market conditions or economic circumstances. All investments involve risk, including loss of principal. You should consult with an investment professional before making any investment decisions.
Varad Kabade
Hi AlMoJo,
To change the timeframe of the entire algorithm we recommend adding the following to the Initialize method:
Note that the algorithm uses higher frequency bars to create lower-frequency bars. Therefore to use indicators or consolidators at the hourly resolution we need to have the universe at the minute, seconds, or hourly resolution.
Best,
Varad Kabade
The material on this website is provided for informational purposes only and does not constitute an offer to sell, a solicitation to buy, or a recommendation or endorsement for any security or strategy, nor does it constitute an offer to provide investment advisory services by QuantConnect. In addition, the material offers no opinion with respect to the suitability of any security or specific investment. QuantConnect makes no guarantees as to the accuracy or completeness of the views expressed in the website. The views are subject to change, and may have become unreliable for various reasons, including changes in market conditions or economic circumstances. All investments involve risk, including loss of principal. You should consult with an investment professional before making any investment decisions.
Will Berger INVESTOR
Hey Guys and Sherry,
Thanks for this incredible thread. So many interesting ideas!
Will
The material on this website is provided for informational purposes only and does not constitute an offer to sell, a solicitation to buy, or a recommendation or endorsement for any security or strategy, nor does it constitute an offer to provide investment advisory services by QuantConnect. In addition, the material offers no opinion with respect to the suitability of any security or specific investment. QuantConnect makes no guarantees as to the accuracy or completeness of the views expressed in the website. The views are subject to change, and may have become unreliable for various reasons, including changes in market conditions or economic circumstances. All investments involve risk, including loss of principal. You should consult with an investment professional before making any investment decisions.
To unlock posting to the community forums please complete at least 30% of Boot Camp.
You can continue your Boot Camp training progress from the terminal. We hope to see you in the community soon!