


Abstract
In this tutorial, we monitor the news sentiment for the constituents of 25 different sector Exchange Traded Funds (ETFs). We periodically rebalance the portfolio of ETFs to maximize our exposure to the sectors with the greatest public sentiment. The results show that the strategy consistently outperforms several benchmark approaches.
Background
Sector rotation is a strategy where you move capital among a set of sectors in an effort to outperform the overall market. Each market sector has an environment in which it performs best. Therefore, by increasing your exposure to the best performing sectors and decreasing your exposure to the worst performing sectors, you can concentrate your portfolio in the sectors that are favorable to the current market environment.
Method
Let’s examine how we can implement a sector rotation strategy based on news sentiment with the LEAN algorithmic trading engine and datasets from the QuantConnect Dataset Market.
Universe Selection
This algorithm requires three universes.
First, we need a static universe of the sector ETFs. To avoid selection bias, we use all of the 25 sector ETFs from the CNBC website.
+ Expand
var tickers = new[]{"XLE", // Energy Select Sector SPDR Fund"XLF", // Financial Select Sector SPDR Fund"XLU", // Utilities Select Sector SPDR Fund"XLI", // Industrial Select Sector SPDR Fund"GDX", // VanEck Gold Miners ETF"XLK", // Technology Select Sector SPDR Fund"XLV", // Health Care Select Sector SPDR Fund"XLY", // Consumer Discretionary Select Sector SPDR Fund"XLP", // Consumer Staples Select Sector SPDR Fund"XLB", // Materials Select Sector SPDR Fund"XOP", // Spdr S&P Oil & Gas Exploration & Production Etf"IYR", // iShares U.S. Real Estate ETF"XHB", // Spdr S&P Homebuilders Etf"ITB", // iShares U.S. Home Construction ETF"VNQ", // Vanguard Real Estate Index Fund ETF Shares"GDXJ",// VanEck Junior Gold Miners ETF"IYE", // iShares U.S. Energy ETF"OIH", // VanEck Oil Services ETF"XME", // SPDR S&P Metals & Mining ETF"XRT", // Spdr S&P Retail Etf"SMH", // VanEck Semiconductor ETF"IBB", // iShares Biotechnology ETF"KBE", // SPDR S&P Bank ETF"KRE", // SPDR S&P Regional Banking ETF"XTL" // SPDR S&P Telecom ETF};foreach (var ticker in tickers){var etfSymbol = AddEquity(ticker, Resolution.DAILY).symbol;// …}
Second, we need an ETF Constituents universe so we can get the dynamic constituents of each sector ETF.
foreach (var ticker in tickers){var etfSymbol = AddEquity(ticker, Resolution.DAILY).symbol;AddUniverse(Universe.etf(etfSymbol, Market.USA, UniverseSettings,constituents =>{_etfConstituentsDataBySymbol[etfSymbol] = constituents;return Enumerable.empty<Symbol>();}));}
Third, we need a BrainSentimentIndicatorUniverse so we can get the Brain Sentiment Indicator values of the constituents in each market sector.
AddUniverse<BrainSentimentIndicatorUniverse>("BrainSentimentIndicatorUniverse", Resolution.DAILY,alt_coarse =>{_brain_universe_data = alt_coarse.to_list();return Enumerable.empty<Symbol>();});
Scheduling Rebalances
We set a Scheduled Event to trigger monthly rebalances. To test how sensitive the algorithm’s performance is to the rebalancing date, we use a parameter to test rebalancing the portfolio on the 1st, 5th, and 12th trading day of each month.
Schedule.on(DateRules.month_start(GetParameter("rebalance-day", 0)),TimeRules.midnight,() =>{_rebalance = true;});
Calculating Sector Sentiment
We utilize the Brain Sentiment Indicator dataset to calculate the sentiment of each sector. The indicator values are created by analyzing financial news using Natural Language Processing techniques while taking into account the similarity and repetition of news on the same topic. The sentiment score assigned to each stock ranges from -1 (most negative) to +1 (most positive). The 30-day sentiment score of a security corresponds to the average sentiment for each piece of news for the security over the last 30 days.
During each rebalance, we calculate the sentiment of each sector through the following procedure:
- Select a sector ETF.
- Select the ETF constituents that have Brain Sentiment Indicator data.
- Multiply the Brain Sentiment over the last 30 days by the ETF weight of each constituent.
- Sum up the set of products from the previous step.
foreach (var kvp in _etf_constituents_dataBysymbol){var etfsymbol = kvp.key;var etf_constituents_data = kvp.value;var sector_symbols = etf_constituents_data.select(etf_constituents_data => etf_constituents_data.symbol).to_hash_set();var etfWeightBysymbol = sector_symbols.to_dictionary(sector_symbol => sector_symbol,sector_symbol => etf_constituents_data.where(etf_constituents_data => etf_constituents_data.symbol == sector_symbol).first_or_default().weight);_scoreBySector[etfsymbol] = _brainUniverseData.where(brain_sentiment => sector_symbols.contains(brain_sentiment.symbol)).select(brain_sentiment => brain_sentiment.sentiment30_days * etfWeightBysymbol[brain_sentiment.symbol]).sum();}
Rotating Between Sectors
After determining the sentiment of each sector, we select the three sectors with the greatest news sentiment and place orders to allocate ⅓ of our capital to the three corresponding sector ETFs.
// Select target ETFsvar targetSymbols = _scoreBySector.order_by_descending(x => x.value).take(_numEtfs).select(kvp => kvp.key);// Liquidate ETFs that are no longer targetedSetHoldings(Portfolio.where(kvp => kvp.value.INVESTED && !targetSymbols.contains(kvp.key)).select(kvp => new PortfolioTarget(kvp.key, 0)).to_list());// Rebalance targeted ETFsvar weight = 1.0m / _numEtfs;SetHoldings(targetSymbols.select(symbol => new PortfolioTarget(symbol, weight)).to_list());
Results
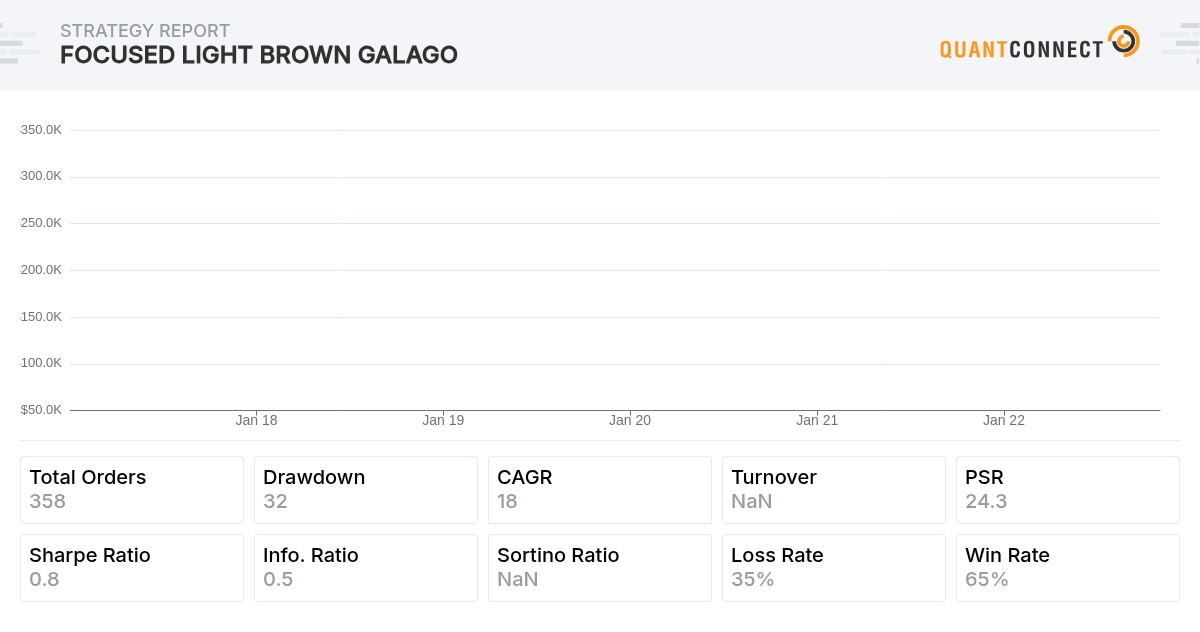
We backtested several versions of the strategy from January 1, 2017 to November 1, 2022. The following image displays the equity curves of each version of the strategy and each version of the benchmark when we rebalance the portfolio on the first trading day of each month.

The following table summarizes each version of the algorithm and shows its resulting Sharpe ratio. To reproduce our results, clone and backtest each algorithm.
| Algorithm | Sharpe Ratio | Description |
|---|---|---|
| Benchmark - SPY | 0.564 | Allocate 100% of the portfolio to the S&P 500 Index ETF. |
| Benchmark - Equal Weighting | 0.436 | During each rebalance, allocate an equal portion of the portfolio to each sector ETF. |
| Benchmark - Momentum | 0.336 | During each rebalance, allocate an equal portfolio of the portfolio to the n (3) sector ETFs that had the greatest return over the last month. |
| Strategy - Simple Average | 0.59 | Calculate the sector sentiment by taking the average sentiment of all the ETF constituents. During each rebalance, allocate an equal portion of the portfolio to the top n (3) sector ETFs. |
| Strategy - Simple Average of Top Performers | 0.697 | Calculate the sector sentiment by taking the average sentiment of the x% (50%) of ETF constituents with the largest weight in the ETF. During each rebalance, allocate an equal portion of the portfolio to the top n (3) sector ETFs. This technique lets us diverge from the ETF and only trade constituents that matter. |
| Strategy - Weighted Average | 0.806 | Calculate the sector sentiment by taking the weighted average of all the ETF constituents. During each rebalance, allocate an equal portion of the portfolio to the top n (3) sector ETFs. This technique reflects the fact that the sentiment of large constituents has more impact on the sector performance. |


Eric Kao
I am getting errors when trying to run the weighted average strategy. Could use some help fixing this. The specific build errors are:
Build Error File: Main.cs Line:68 Column:41 - Cannot implicitly convert type 'System.Collections.Generic.List' to 'System.Collections.Generic.List'
Build Error File: Main.cs Line:108 Column:66 - Cannot implicitly convert type 'System.Collections.Generic.IEnumerable' to 'System.Collections.Generic.IEnumerable'. An explicit conversion exists (are you missing a cast?)
Build Error File: Main.cs Line:108 Column:66 - Cannot implicitly convert type 'System.Collections.Generic.IEnumerable' to 'System.Collections.Generic.IEnumerable'. An explicit conversion exists (are you missing a cast?)
The material on this website is provided for informational purposes only and does not constitute an offer to sell, a solicitation to buy, or a recommendation or endorsement for any security or strategy, nor does it constitute an offer to provide investment advisory services by QuantConnect. In addition, the material offers no opinion with respect to the suitability of any security or specific investment. QuantConnect makes no guarantees as to the accuracy or completeness of the views expressed in the website. The views are subject to change, and may have become unreliable for various reasons, including changes in market conditions or economic circumstances. All investments involve risk, including loss of principal. You should consult with an investment professional before making any investment decisions.
Louis Szeto
Hi Eric
We have some refactoring in Lean, so the old data type is not working. Please refer to this backtest. They are the same wine in a different bottle.
Best
Louis
The material on this website is provided for informational purposes only and does not constitute an offer to sell, a solicitation to buy, or a recommendation or endorsement for any security or strategy, nor does it constitute an offer to provide investment advisory services by QuantConnect. In addition, the material offers no opinion with respect to the suitability of any security or specific investment. QuantConnect makes no guarantees as to the accuracy or completeness of the views expressed in the website. The views are subject to change, and may have become unreliable for various reasons, including changes in market conditions or economic circumstances. All investments involve risk, including loss of principal. You should consult with an investment professional before making any investment decisions.
Andres Arizpe
Does anyone have by any chance a Python version of this algo?
It works great but I'm not fluent in C# and cannot make some of the changes I would want to.
Cheers,
Andres
The material on this website is provided for informational purposes only and does not constitute an offer to sell, a solicitation to buy, or a recommendation or endorsement for any security or strategy, nor does it constitute an offer to provide investment advisory services by QuantConnect. In addition, the material offers no opinion with respect to the suitability of any security or specific investment. QuantConnect makes no guarantees as to the accuracy or completeness of the views expressed in the website. The views are subject to change, and may have become unreliable for various reasons, including changes in market conditions or economic circumstances. All investments involve risk, including loss of principal. You should consult with an investment professional before making any investment decisions.
Ashutosh
Hi Andres Arizpe
This is the Python version of the code.
The material on this website is provided for informational purposes only and does not constitute an offer to sell, a solicitation to buy, or a recommendation or endorsement for any security or strategy, nor does it constitute an offer to provide investment advisory services by QuantConnect. In addition, the material offers no opinion with respect to the suitability of any security or specific investment. QuantConnect makes no guarantees as to the accuracy or completeness of the views expressed in the website. The views are subject to change, and may have become unreliable for various reasons, including changes in market conditions or economic circumstances. All investments involve risk, including loss of principal. You should consult with an investment professional before making any investment decisions.
To unlock posting to the community forums please complete at least 30% of Boot Camp.
You can continue your Boot Camp training progress from the terminal. We hope to see you in the community soon!