Investopedia recently came out with an article on Warren Buffet’s barometer for gauging stock market valuations and how it currently shows an extreme overvaluation of the market. The “Buffet Indicator” is the ratio of market capitalization of all publicly-traded U.S. stocks to U.S. GDP. The article states that when the ratio is between 70%-80% it safe to put in stocks, 100% means danger and 140% means extreme danger. We are currently at a record high of 138%.
I thought it would be interesting to gauge the performance of this indicator using the historical data provided by QuantConnect and see how well it predicted previously overvalued markets. In the algorithm below I would stay invested in the SPY until the ratio reached the danger mark or 100%, and exit until the markets were not overvalued.
Sources:
https://www.investopedia.com/news/buffett-indicator-spells-bad-news-stock-investors/
Gurumeher Sawhney
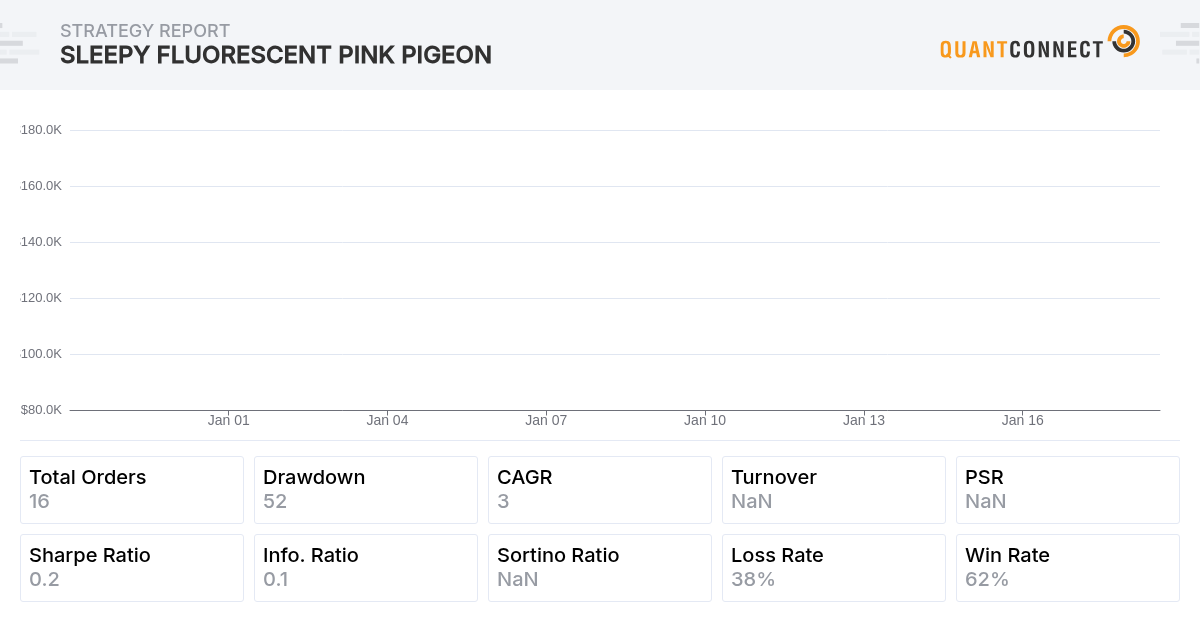
The basic strategy using the Buffet Indicator ended up not working as well as I hoped. There were some long flat periods and during the 2008 market crash the indicator went below 1 so we took a large loss. I created another strategy using what I learned with the mindset of still being a risk-averse investor but also riding the trends of the Buffet Indicator. If the market was overvalued or the market value was falling I stayed in AGG, otherwise, I invested in the QQQ. Due to the inception dates of the ETFs used, I was only able to back test to 2003. The results below pleasantly handled the 2008 market crash. It will be interesting to see how the “overvalued” stock market plays out in the coming months.
The material on this website is provided for informational purposes only and does not constitute an offer to sell, a solicitation to buy, or a recommendation or endorsement for any security or strategy, nor does it constitute an offer to provide investment advisory services by QuantConnect. In addition, the material offers no opinion with respect to the suitability of any security or specific investment. QuantConnect makes no guarantees as to the accuracy or completeness of the views expressed in the website. The views are subject to change, and may have become unreliable for various reasons, including changes in market conditions or economic circumstances. All investments involve risk, including loss of principal. You should consult with an investment professional before making any investment decisions.
Saun Marsh
Let us look at the Buffett Indicator; first for the U.S. market, and then for several emerging markets. The chart below graphs both U.S. GDP and the U.S. stock market for the past sixty years. It is interesting to look at the graph in the context of Buffett’s investment career, which coincidentally extends for the sixty years of data. First, the period from 1960 to 1970 was one of consternation for value investors like Buffett who felt that valuations were extremely high. Buffett closed his initial partnership in 1969, partially because he felt valuations were too high to remain invested. Second, the period 1974 to 1997 which were Buffett’s most successful years. He thrived in the 1970s, an environment of very low valuations caused by high inflation. Third, 1998 to 2001 was a period of serious underperformance for Buffett, as he was out of the high-flying technology stocks. Fourth, from 2001 until today, Buffett has not performed as well as in the past, only outperforming the market during the large drawdowns of 2002 and 2008. The “Buffett Indicator” today points to very high valuations, and probably to a big opportunity for Buffett to capture alpha (relative market performance) in the next downturn.
The material on this website is provided for informational purposes only and does not constitute an offer to sell, a solicitation to buy, or a recommendation or endorsement for any security or strategy, nor does it constitute an offer to provide investment advisory services by QuantConnect. In addition, the material offers no opinion with respect to the suitability of any security or specific investment. QuantConnect makes no guarantees as to the accuracy or completeness of the views expressed in the website. The views are subject to change, and may have become unreliable for various reasons, including changes in market conditions or economic circumstances. All investments involve risk, including loss of principal. You should consult with an investment professional before making any investment decisions.
Simone Pantaleoni
Apologies :P Tagged the wrong Frank and cannot amend it now unfortunately :) anyway, better a compliment more, than one less isn't it? :P
The material on this website is provided for informational purposes only and does not constitute an offer to sell, a solicitation to buy, or a recommendation or endorsement for any security or strategy, nor does it constitute an offer to provide investment advisory services by QuantConnect. In addition, the material offers no opinion with respect to the suitability of any security or specific investment. QuantConnect makes no guarantees as to the accuracy or completeness of the views expressed in the website. The views are subject to change, and may have become unreliable for various reasons, including changes in market conditions or economic circumstances. All investments involve risk, including loss of principal. You should consult with an investment professional before making any investment decisions.
Frank Giardina
From the comments above from Frank Schikarski about using the High Yield Spread, attached is I think the FRED alternative dataset he is talking about. If someone can confirm that would be great. I did not see another dataset that fit the description
The material on this website is provided for informational purposes only and does not constitute an offer to sell, a solicitation to buy, or a recommendation or endorsement for any security or strategy, nor does it constitute an offer to provide investment advisory services by QuantConnect. In addition, the material offers no opinion with respect to the suitability of any security or specific investment. QuantConnect makes no guarantees as to the accuracy or completeness of the views expressed in the website. The views are subject to change, and may have become unreliable for various reasons, including changes in market conditions or economic circumstances. All investments involve risk, including loss of principal. You should consult with an investment professional before making any investment decisions.
Vladimir
Simone Pantaleoni,
Try this one
The material on this website is provided for informational purposes only and does not constitute an offer to sell, a solicitation to buy, or a recommendation or endorsement for any security or strategy, nor does it constitute an offer to provide investment advisory services by QuantConnect. In addition, the material offers no opinion with respect to the suitability of any security or specific investment. QuantConnect makes no guarantees as to the accuracy or completeness of the views expressed in the website. The views are subject to change, and may have become unreliable for various reasons, including changes in market conditions or economic circumstances. All investments involve risk, including loss of principal. You should consult with an investment professional before making any investment decisions.
Vladimir
Simone Pantaleoni,
Here is a backtest for OECD/KEI_LOLITOAA_KOR_ST_M from my June 2021 research.
I'd better chat with you in this thread.
The material on this website is provided for informational purposes only and does not constitute an offer to sell, a solicitation to buy, or a recommendation or endorsement for any security or strategy, nor does it constitute an offer to provide investment advisory services by QuantConnect. In addition, the material offers no opinion with respect to the suitability of any security or specific investment. QuantConnect makes no guarantees as to the accuracy or completeness of the views expressed in the website. The views are subject to change, and may have become unreliable for various reasons, including changes in market conditions or economic circumstances. All investments involve risk, including loss of principal. You should consult with an investment professional before making any investment decisions.
Vladimir
Simone Pantaleoni,
Here is a backtest for OECD "OECD/KEI_LOLITOAA_JPN_ST_M" from my June 2021 research.
The material on this website is provided for informational purposes only and does not constitute an offer to sell, a solicitation to buy, or a recommendation or endorsement for any security or strategy, nor does it constitute an offer to provide investment advisory services by QuantConnect. In addition, the material offers no opinion with respect to the suitability of any security or specific investment. QuantConnect makes no guarantees as to the accuracy or completeness of the views expressed in the website. The views are subject to change, and may have become unreliable for various reasons, including changes in market conditions or economic circumstances. All investments involve risk, including loss of principal. You should consult with an investment professional before making any investment decisions.
Frank Giardina
This is a work in progress. I cloned one of Vlad's earlier versions. I really like this algo for a macro view of investing. This version can probably be done in less code, average python coder here. I wanted to see what the economic stage/cycles have been since 2012 based on the kei strategy and then see how different ETFs performed in that cycle. I wanted to make it flexible enough to add and remove ETFs . Next i wanted to output the results to a comma separated log file so i could import to excel to see which ETFs performed the best. Any feedback / improvements greatly appreciated. One issue i am trying to fix is to add the number of days that a stage lasted, can't seem to get the python date functions to work (probably me)
The material on this website is provided for informational purposes only and does not constitute an offer to sell, a solicitation to buy, or a recommendation or endorsement for any security or strategy, nor does it constitute an offer to provide investment advisory services by QuantConnect. In addition, the material offers no opinion with respect to the suitability of any security or specific investment. QuantConnect makes no guarantees as to the accuracy or completeness of the views expressed in the website. The views are subject to change, and may have become unreliable for various reasons, including changes in market conditions or economic circumstances. All investments involve risk, including loss of principal. You should consult with an investment professional before making any investment decisions.
Simone Pantaleoni
Frank Giardina Thanks for joining the Team Frank! :)
I've created different versions of this strategy - the one below is what I'm using live:
PSR and DD are the best parts of this strategy in my opinion :)
The material on this website is provided for informational purposes only and does not constitute an offer to sell, a solicitation to buy, or a recommendation or endorsement for any security or strategy, nor does it constitute an offer to provide investment advisory services by QuantConnect. In addition, the material offers no opinion with respect to the suitability of any security or specific investment. QuantConnect makes no guarantees as to the accuracy or completeness of the views expressed in the website. The views are subject to change, and may have become unreliable for various reasons, including changes in market conditions or economic circumstances. All investments involve risk, including loss of principal. You should consult with an investment professional before making any investment decisions.
Frank Giardina
Very impressive, if anyone wants to conference call or collaborate and kick around some ideas, always up for that. I plan on looking at my results and trying some different approaches. Especially in the area of sub stages within the stage and how to speed the indicator. I also want to start using this in 2022
The material on this website is provided for informational purposes only and does not constitute an offer to sell, a solicitation to buy, or a recommendation or endorsement for any security or strategy, nor does it constitute an offer to provide investment advisory services by QuantConnect. In addition, the material offers no opinion with respect to the suitability of any security or specific investment. QuantConnect makes no guarantees as to the accuracy or completeness of the views expressed in the website. The views are subject to change, and may have become unreliable for various reasons, including changes in market conditions or economic circumstances. All investments involve risk, including loss of principal. You should consult with an investment professional before making any investment decisions.
JSO 2045
Hi guys. I'm pretty new to this so apologies for not having that much in the way of useful contribution to this conversation. Has anyone found a way to alleviate/offset 2022's downturn for this strategy (and a lot of others), or is the freakish nature of what's happened not something that can be effectively accounted for? Main reason for asking is that the low drawdown/volatiltiy of this strategy seemed like a big strength but has obviously taken a hit this year
All I can think of would be adding small hedges against each of the orders made by the algo in each of its “stages.” I will give it a try but am keen to hear what other peoples' thoughts are :)
The material on this website is provided for informational purposes only and does not constitute an offer to sell, a solicitation to buy, or a recommendation or endorsement for any security or strategy, nor does it constitute an offer to provide investment advisory services by QuantConnect. In addition, the material offers no opinion with respect to the suitability of any security or specific investment. QuantConnect makes no guarantees as to the accuracy or completeness of the views expressed in the website. The views are subject to change, and may have become unreliable for various reasons, including changes in market conditions or economic circumstances. All investments involve risk, including loss of principal. You should consult with an investment professional before making any investment decisions.
Frank Giardina
Not sure what to add , but there is another OECD dataset from the Federal Reserve site FRED https://fred.stlouisfed.org/ called USALOLITONOSTSAM. My understanding is this dataset is US only as opposed to the QUANDL dataset used in the algo. I have not been able to figure out how to get Quantconnect to use this data set instead. If i could figure out how to use that one instead I would. The two datasets are 90% correlated. In the meantime I am using a python notebook in Google colab to do the analysis. The Quandl indicator has indicated we are in a decline since April the FRED indicator says since March. I have noticed that with the FRED data they do go back and adjust the data so that does throw things off at times. If there is an interest in the notebook let me know and i will copy it in the post.
The material on this website is provided for informational purposes only and does not constitute an offer to sell, a solicitation to buy, or a recommendation or endorsement for any security or strategy, nor does it constitute an offer to provide investment advisory services by QuantConnect. In addition, the material offers no opinion with respect to the suitability of any security or specific investment. QuantConnect makes no guarantees as to the accuracy or completeness of the views expressed in the website. The views are subject to change, and may have become unreliable for various reasons, including changes in market conditions or economic circumstances. All investments involve risk, including loss of principal. You should consult with an investment professional before making any investment decisions.
Simone Pantaleoni
Hi Frank and JSO,The one you've picked, as you said, is US-only leading indicators - there're plenty available indeed (roughly one per country), but I would suggest to use the oecd or the world oneIn order instead to limit drawdown during 2022, just switch to cash (or “BIL” or “SHV”) when the TLT correlation to SPY is positive.Enjoy it
ps. if you like my comment, drop me some points/likes ;)
The material on this website is provided for informational purposes only and does not constitute an offer to sell, a solicitation to buy, or a recommendation or endorsement for any security or strategy, nor does it constitute an offer to provide investment advisory services by QuantConnect. In addition, the material offers no opinion with respect to the suitability of any security or specific investment. QuantConnect makes no guarantees as to the accuracy or completeness of the views expressed in the website. The views are subject to change, and may have become unreliable for various reasons, including changes in market conditions or economic circumstances. All investments involve risk, including loss of principal. You should consult with an investment professional before making any investment decisions.
Simone Pantaleoni
Just forgot to mention - I'm always open to collaborations - I'm available on Telegram or Discord (but I would prefer the first one, since I'm not a very heavy Discord user) :)
The material on this website is provided for informational purposes only and does not constitute an offer to sell, a solicitation to buy, or a recommendation or endorsement for any security or strategy, nor does it constitute an offer to provide investment advisory services by QuantConnect. In addition, the material offers no opinion with respect to the suitability of any security or specific investment. QuantConnect makes no guarantees as to the accuracy or completeness of the views expressed in the website. The views are subject to change, and may have become unreliable for various reasons, including changes in market conditions or economic circumstances. All investments involve risk, including loss of principal. You should consult with an investment professional before making any investment decisions.
JSO 2045
Simone Pantaleoni I like that idea of using the correlation, will try to give it a go. Finding a valid solution to this specific problem would help loads of strategies in the forums as well as this one. Could potentially even have a list of traditional hedges against the stock market and select the one with the lowest correlation across the last month (or something like that)
The material on this website is provided for informational purposes only and does not constitute an offer to sell, a solicitation to buy, or a recommendation or endorsement for any security or strategy, nor does it constitute an offer to provide investment advisory services by QuantConnect. In addition, the material offers no opinion with respect to the suitability of any security or specific investment. QuantConnect makes no guarantees as to the accuracy or completeness of the views expressed in the website. The views are subject to change, and may have become unreliable for various reasons, including changes in market conditions or economic circumstances. All investments involve risk, including loss of principal. You should consult with an investment professional before making any investment decisions.
Peter Guenther
Great job again, Simone Pantaleoni and Strongs, for getting this discussion started!
Sorry, time resources have been a bit tight. Anyway, I am currently musing about whether this could be used to trade FX pairs. The OECD data gives you international information about the comparative strengths of various economies. You got your interest rates, GDP growth, inflation figures, unemployment rates and so on, Based on this, one might be able to bet on one currency vs the other and/or to validate or refute existing trends in currency pairs. Hopefully, I can put something together over the next few weeks for the major currency pairs.
The time lag of the data (up to one month?) could be an issue for live trading – to what extent could be tested by simulating lagged data usage. If it is a substantive issue, the question will be whether more up-to-date datasets could be identified, such as by getting the data directly from the national bureaus of statistics or similar.
The material on this website is provided for informational purposes only and does not constitute an offer to sell, a solicitation to buy, or a recommendation or endorsement for any security or strategy, nor does it constitute an offer to provide investment advisory services by QuantConnect. In addition, the material offers no opinion with respect to the suitability of any security or specific investment. QuantConnect makes no guarantees as to the accuracy or completeness of the views expressed in the website. The views are subject to change, and may have become unreliable for various reasons, including changes in market conditions or economic circumstances. All investments involve risk, including loss of principal. You should consult with an investment professional before making any investment decisions.
Simone Pantaleoni
Hi Peter Guenther
Well spotted: publication delay can affect live performances, so to avoid so I've been “reading” the KEI value on the 15th of each month, basically taking into account the publication date instead of the “validity” date
About the FX Pair, that is actually another great idea, and should be rather easy to realize, even tough I would be curious to see if that is able to generate alpha since carry trade is also “a thing” - perhaps a better idea would be to pair trade Country-ETFs based on the related KEI strength
ps. Still need to get in touch with you privately Peter - how can I reach out to you?
The material on this website is provided for informational purposes only and does not constitute an offer to sell, a solicitation to buy, or a recommendation or endorsement for any security or strategy, nor does it constitute an offer to provide investment advisory services by QuantConnect. In addition, the material offers no opinion with respect to the suitability of any security or specific investment. QuantConnect makes no guarantees as to the accuracy or completeness of the views expressed in the website. The views are subject to change, and may have become unreliable for various reasons, including changes in market conditions or economic circumstances. All investments involve risk, including loss of principal. You should consult with an investment professional before making any investment decisions.
Peter Guenther
That's great, Simone Pantaleoni. I will definitely share as soon as I've got a first version of the FX algo.
My contact:
The material on this website is provided for informational purposes only and does not constitute an offer to sell, a solicitation to buy, or a recommendation or endorsement for any security or strategy, nor does it constitute an offer to provide investment advisory services by QuantConnect. In addition, the material offers no opinion with respect to the suitability of any security or specific investment. QuantConnect makes no guarantees as to the accuracy or completeness of the views expressed in the website. The views are subject to change, and may have become unreliable for various reasons, including changes in market conditions or economic circumstances. All investments involve risk, including loss of principal. You should consult with an investment professional before making any investment decisions.
To unlock posting to the community forums please complete at least 30% of Boot Camp.
You can continue your Boot Camp training progress from the terminal. We hope to see you in the community soon!