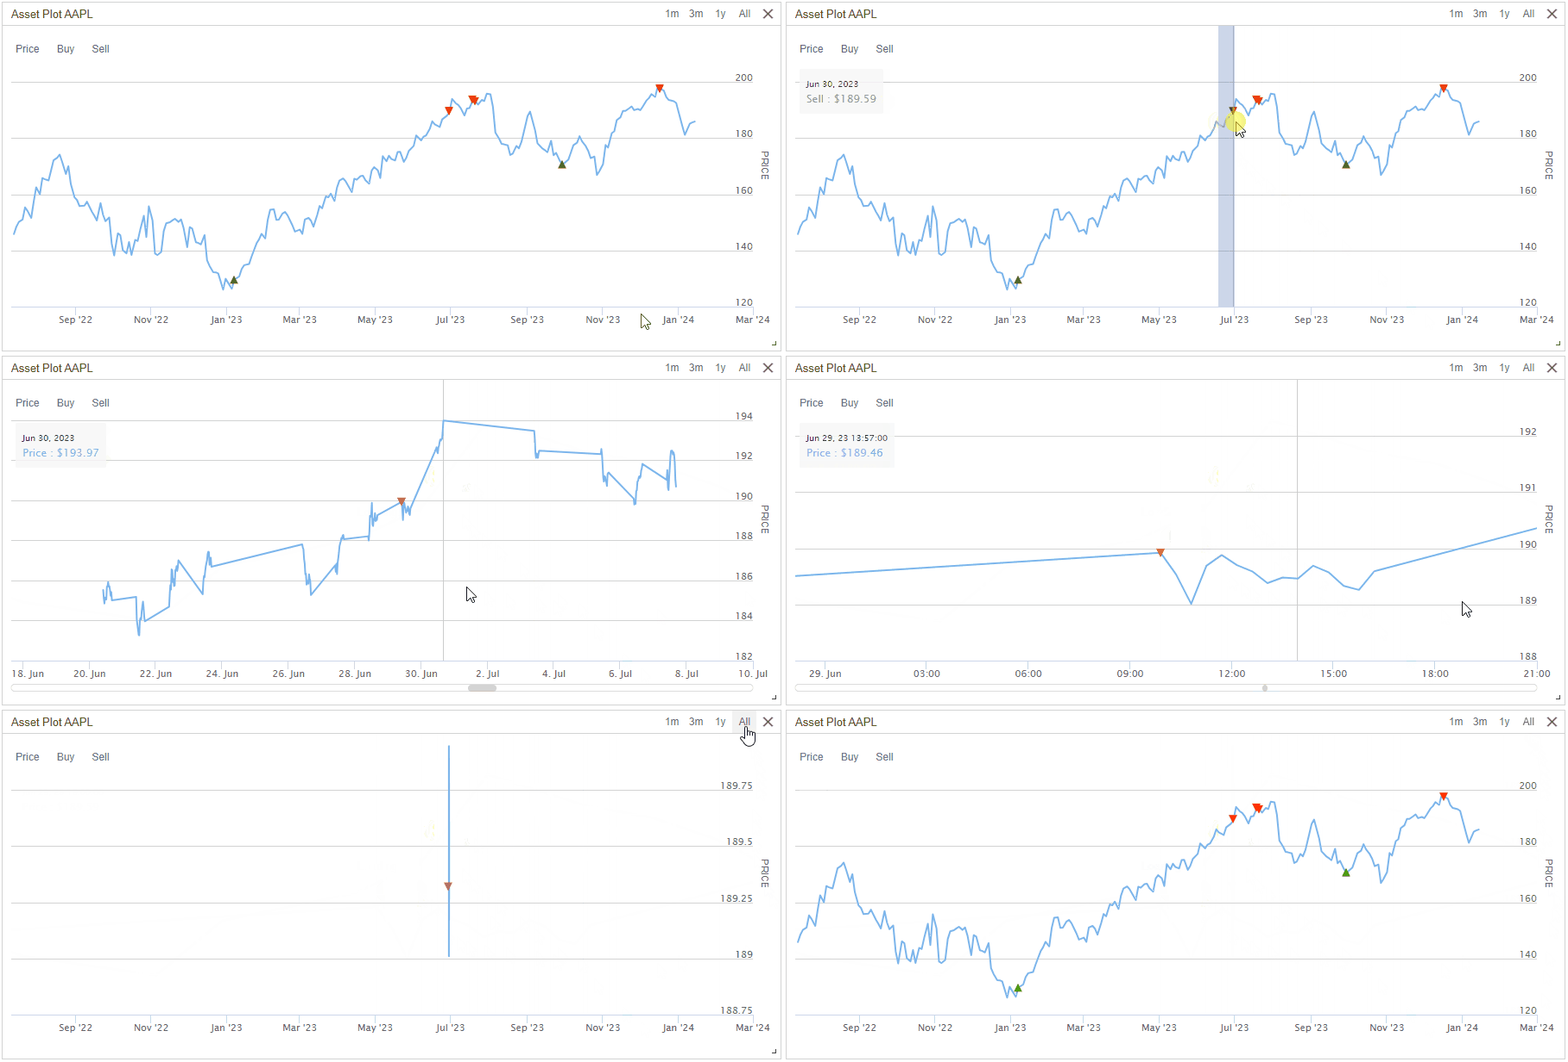
Last week we released new key technology that powers all QuantConnect charting. The new result service enables you to run backtests with high-resolution custom charting, accelerating your understanding of strategies and order fills.
Our community, skilled in quantitative finance, previously experienced limitations charting with long-term backtesting. Analyzing 25 years of intra-day data with millions of points per backtest was challenging due to the immense volume of chart and order data. This often resulted in failed chart loads and API errors, hindering in-depth strategy evaluation.
We're excited to introduce our new charting engine, specifically designed for the complexities of quantitative finance. Backtest results are cached in a powerful cloud and delivered on demand as needed. You can now can create bespoke, long-term, intraday charts and manipulate those charts with ease.
Order Plot Visualization: You can now automatically visualize order fills on price plots without additional coding. LEAN carefully models the sequence of events during a trade - such as order submission, updates, and cancellations. These events are displayed with their tags to offer a granular view of your strategy state during execution.

Expanded Storage and Chart Limits: Thanks to this new charting engine, we've significantly increased chart series and point limits based on organizational tiers.
| Plan | Points | Series |
| Free | 4K | 10 |
| Researcher | 8K | 10 |
| Team | 16K | 25 |
| Trading Firm | 32K | 25 |
| Institutional | 96K | 100 |
Dive deeper into these enhancements by visiting our Asset Plot documentation page. We're committed to pushing the edges of open-source quantitative finance and are excited to see how these technologies make your quantitative journey easier.
QuantConnect Team


Will Berger
This is great Jared! Looking forward to trying it out!
.ekz.
Amazing! Thanks for the update!
RyanB
Excellent!
Is there an easy way to add indicator series to these asset plots (e.g. plotting a simple SMA cross) as well?
RyanB
Jared Broad
The material on this website is provided for informational purposes only and does not constitute an offer to sell, a solicitation to buy, or a recommendation or endorsement for any security or strategy, nor does it constitute an offer to provide investment advisory services by QuantConnect. In addition, the material offers no opinion with respect to the suitability of any security or specific investment. QuantConnect makes no guarantees as to the accuracy or completeness of the views expressed in the website. The views are subject to change, and may have become unreliable for various reasons, including changes in market conditions or economic circumstances. All investments involve risk, including loss of principal. You should consult with an investment professional before making any investment decisions.
To unlock posting to the community forums please complete at least 30% of Boot Camp.
You can continue your Boot Camp training progress from the terminal. We hope to see you in the community soon!